Global Temperature
Additional figures are on More Figures page.
* * * Monthly and Annual Temperature Tables ***
1880-1920 Base Period
1951-1980 Base Period
* * * * * * Annual Mean Temperature Ranking (Top 10) * * * * * *
The top 10 warmest years were all in the past 11 years (2015-2025)
1880-1920 Base Period
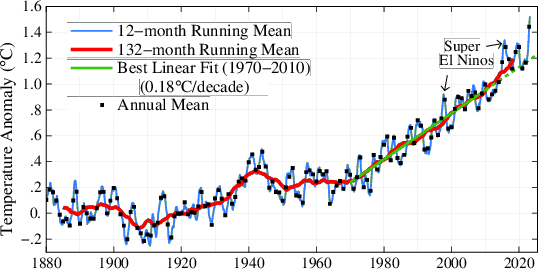
With 1880-1920 Base Period
 >
>
With Predictions Updated on 2026/04/09
With Current Trend Updated on 2026/04/09
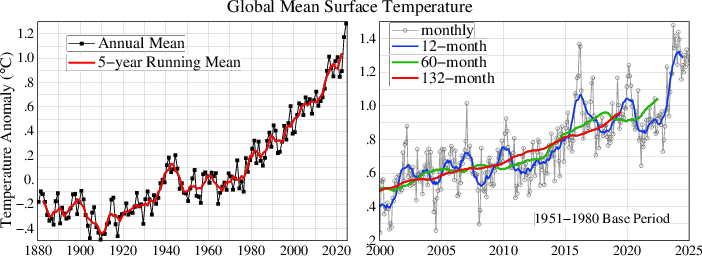
Data through June 2026 are used for computing the means. last modified 2026/07/09, now with GHCN v4 and ERSST v5.)
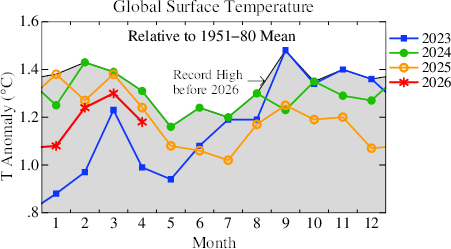
Comparison of temperature of a few years in recent past. Figure also available in PDF (Updated on 2026/07/09, with GHCN v4 and ERSST v5)
Comparison of El Nino/La Nina phase and the global mean temperature change. Figure also available in PDF Note: RONI data (3-month means) are through the April-May-June mean and the global temperature is monthly mean through June. (Updated on 2026/07/09, with GHCN v4 and ERSST v5)
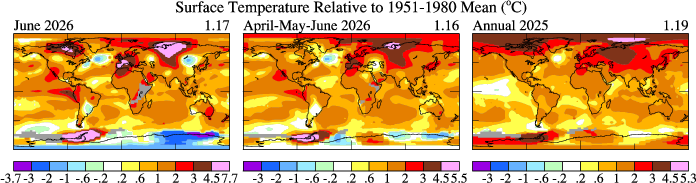
Recent monthly, seasonal and annual mean surface temperature maps. Figure also available in PDF (Updated on 2026/07/09, with GHCN v4 and ERSST v5)
Additional figures are on More Figures page.
Switching to New Versions of Data Sets
GHCN Station Data:
- 2011/12/15: from GHCN v2 to v3
- 2015/06/13: from GHCN v3.2.2 to v3.3.0.
- 2019/06/17: from GHCN v3 to v4
Sea Surface Temperature:
- 2013/01/15: from HadISST1 + OI SST to ERSST.
- 2015/07/19: from ERSST v3b to ERSST v4.
- 2017/08/15: from ERSST v4 to ERSST v5.
AIRS Temperature Data:
NASA/GISS added Surface Temperature Anomaly estimates from Remote Sensed data (Susskind et al. 2019) to be available from its web site.
Our Essays
- Global Warming Acceleration (2020/12/14)
- Accelerated Warming (2020/10/14)
- Race is On, and Here Comes... (2020/06/12)
- Bending the Curves (2020/04/14)
- Global Warming and East Coast Hurricanes (2018/09/17)
- A Better Graph (2016/09/26)
- Global Temperature Update (2015/08/24)
- Global Warming Hole (2015/03/31)
- If It's That Warm, How Come It's So Darned Cold? (2010/01/26)
Monthly Update E-Mails:
- 2024: Feb, Apr, May
- 2023: May, Jun, Jul, Aug, Sep, Nov, Dec (Annual)
- 2022: Jan, Feb, Mar, Apr, May, Jun, Jul, Aug, Dec (annual)
- 2021: Jan, Feb, Mar, Apr, May, Jun, Jul, Aug, Sep, Oct, Nov, Dec (annual)
- 2020: Jan, Feb, Mar, Apr, May, Jun, Jul, Aug, Sep, Oct, Nov, Dec (annual), Annual Figures
- 2019: Jan, Feb, Mar, Apr, May, Jun, Jul, Aug, Sep, Oct, Nov, Dec (annual)
- 2018: Jan, Feb, Mar, Apr, May, Jun, Jul, Aug, Sep, Oct, Nov, Dec (annual)
- 2017: Jan, Feb, Mar, Apr, May, Jun, Jul, Aug, Sep, Oct, Nov, Dec (annual)
- 2016: Jan, Feb, Mar, Apr, May, Jun, Jul, Aug, Sep, Oct, Nov, Dec (annual)
- 2015: Feb Mar, Apr, May, Jul, Aug, Sep, Oct, Dec (annual)
Annual and Decadal Summary:
- Annual: 2014, 2013, 2012, 2011, 2010
- Decadal: 2000-2009
- Annual: 2009, 2008, 2007, 2006, 2005, 2004, 2003, 2002, 2001
Original Data