Updated Figures
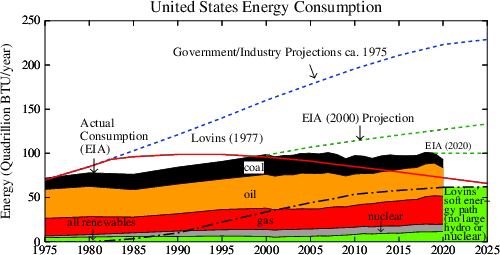
FIGURE 2. Actual Consumption data: Table 1.3 on U.S. Energy Information Administration, Total Energy.
Projection data U.S. Energy Information Administration, Annual Energy Outlook 2019.
Also available in PDF.
(Last modified: 2021/09/08, Actual data through 2020)
FIGURE 11. See an update on Solar irradiancepage.
FIGURE 12. See an update on Global Temperature
FIGURE 13. See an update on More Temperature Figures
FIGURE 14. See an update on Greenhouse Gases
.
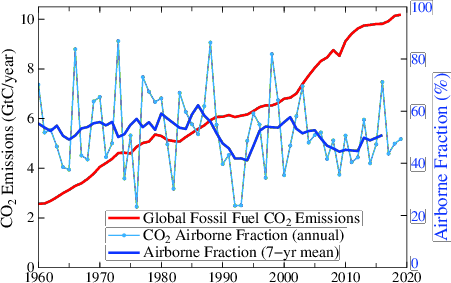
FIGURE 16. Fossil fuel CO2 emissions and the fraction that appears in the atmosphere. (Emissions data from Boden et al., ORNL/CDIAC's web site http://cdiac.ornl.gov/trends/emis/meth_reg.html, and the fraction data are updates of Hansen and Sato, "Greenhouse Gas Growth Rates.)
Also available in PDF.
(Last modified: 2020/06/24, Data through 2019
.
FIGURE 17. Annual carbon dioxide growth as observed through 2015 , in IPCC (2001) scenarios and in the alternative scenario of Hansen et al. (2000).
Also available in PDF.
(Last modified: 2016/04/12, Data through 2015)
.

FIGURE 20. Warm season sea ice area in the Arctic and Antarctic. (Data from National Snow a
nd Ice Data Center Web site, http://nsidc.org/data/seaice_index.)
Also available in PDF.
(Last modified: 2016/04/01)
See sea ice area pages for more figures.
.
Figure 21. See a temperature page for maps of seasonal mean temperature anomalies..
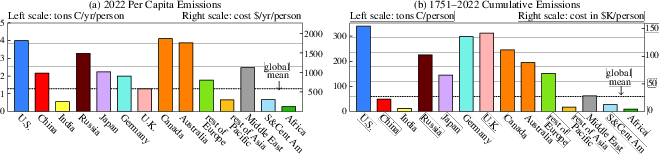
FIGURE 24. Current and cumulative per capita carbon dioxide emissions. (Data sources are Carbon Dioxide Information Analysis Center, Oak Ridge National Laboratory, and British Petroleum.)
(Last modified: 2017/07/30) See emissions pages for more figures.
.
FIGURE 25. Fossil fuel emissions by fuel type for the world and Japan.
(Data sources are Carbon Dioxide Information Analysis Center, Oak Ridge National
Laboratory, and British Petroleum.)
(Last modified: 2014/08/29, Data through 2013)
.
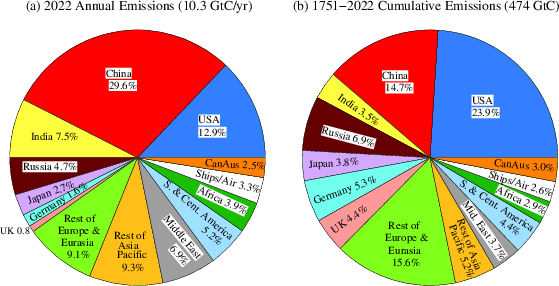
FIGURE 27. Current and cumulative fossil fuel carbon dioxide emissions.
(Data sources are Carbon Dioxide Information Analysis Center, Oak Ridge National
Laboratory, and British Petroleum.)
Also available in PDF. (Last modified: 2017/07/28)
.
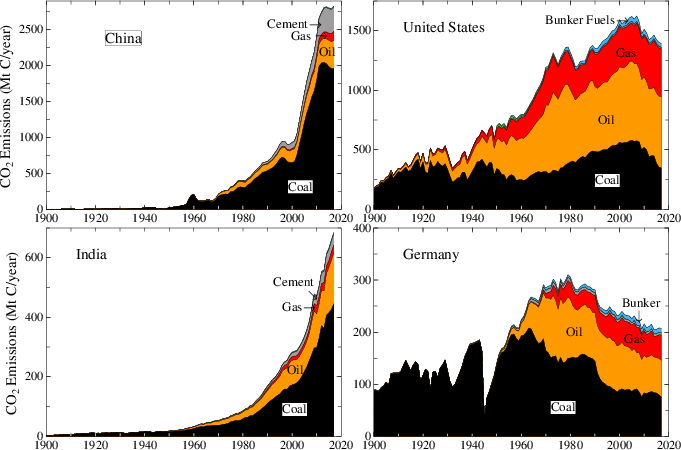
FIGURE 28. Fossil fuel emissions by fuel type for the United States and China. (Data sources are Carbon Dioxide Information Analysis Center, Oak Ridge National Laboratory, and British Petroleum.) (Last modified: 2017/06/19, Data through 2016)