|
|
|
|
|
|
|
|
|
|
|
|
|
|
| screens to caves: real-time data visualization systems
adeola enigbokan
|
|
|
|
 |
|
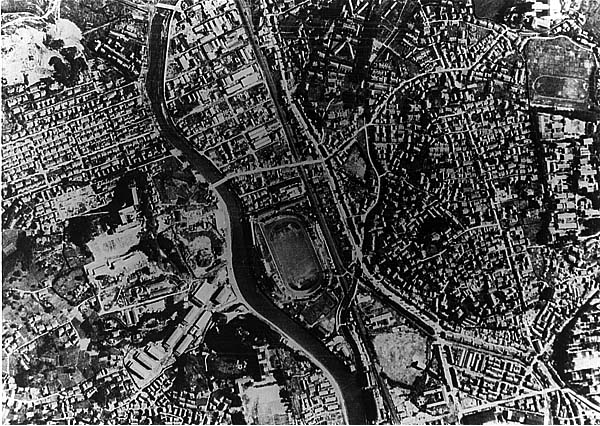
| Imagining the city through the interface is a direct response to the 20th century reality of the city as target. Beginning with the raids on colonized regions of North Africa and Asia in the nineteen-teens, and peaking with the devastation of Warsaw, Dresden, Hiroshima and Nagasaki during World War II, cities were executed from a decidedly remote, aerial perspective. Fighter pilots who targeted cities from the air were aided in the visualization of urban space through a combination of communication |
|
| technologies. Orders and coordinates in place, they were able to proceed with elusive precision. This aerial view was not limited to fighter pilots immediately engaged with the task of demolishing cities, but was inserted into the fabric of Cold War military strategy. With developments in remote electronic communications technology, the ability to accurately imagine distant outside worlds, using computers, from the security of closed, windowless rooms became a strategic mainstay of Cold War operations. |
|
|
|
 |
|
|
|
| aerial view of Nagasaki just two days before... |
|
|
These new technologies, often realized by the research departments of major civilian corporations and universities such as IBM, Rand, and MIT, became structuring of world-views well beyond the theaters of hot or cold wars. The involvement of major corporations in the development of these powerful technologies ensured the proliferation of ‘distant views’ well beyond the military bunkers. In his analysis of the work of Eliot Noyes, industrial designer, architect and IBM’s ‘curator of corporate character,’ from the 1950’s through the 1970’s, architectural historian John Harwood notes the critical nature of such interiors:
|
|
|
It is in investigating this enclosed central space [of rooms filled with computers and their attendants], the site of the dynamic interface between humans and machines engaged in the synchronic real-time management of spaces or fields outside, that the architectural logic linking and organizing the corporate body, computers and design unfolds. (2) |
|
|
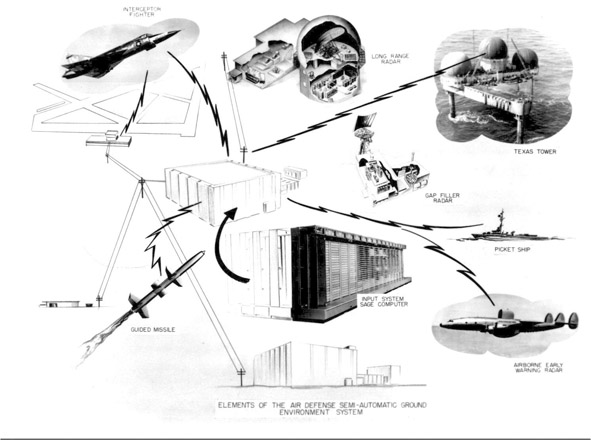
Through participation in commissioned US Air Force projects such as the Semi-Automatic Ground Environment (SAGE) companies like IBM, and the designers in its employ, pioneered the use of real-time technologies for the visualization and control of external environments:
|
|
|
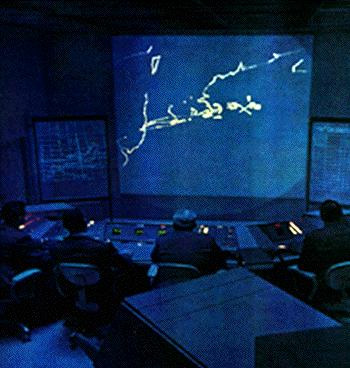
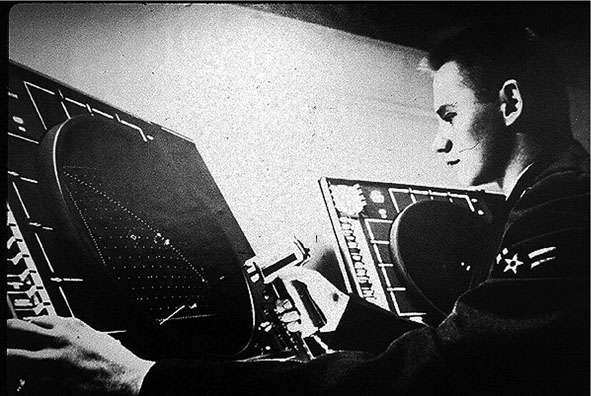
The SAGE computers [used to constantly monitor every cubic foot of US air space]… were directly hooked up to radar installations distributed across the periphery of North America and housed in massive windowless concrete buildings. [These large computers] also required operators… who sat at the radar screens tracking the aircraft, interacting with the computers via light guns, in an environment wholly blank, save for the technology itself… Despite their locations at discrete points, these semi-automatic counterenvironments were topologically pulled together into a more or less seamless network, both at the technological level of information flow and at the level of architecture. (3) |
|
 |
|
|
These concrete windowless rooms, in which the only light emanating was the blue glow of the computer screens, are the spatial and architectural representation of prototypical human-computer interaction that has come to occupy a central role in daily life in the overdeveloped world of late capitalism. The interface, as the medium for interaction between humans and their surrounding environments, implies new spatial conceptions, which while intimately related to the world beyond the computer room, are wholly unique. What are the qualities and implications of this new geospatial conception?
|
|
|
 |
|
|
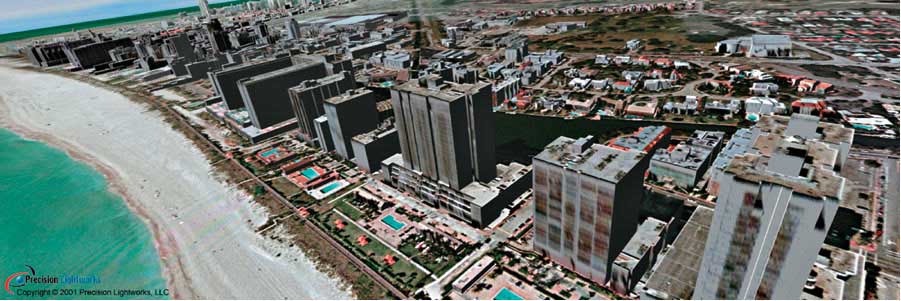
| Since the 1990’s, the 3D technology that supports visualization software has constantly improved and expanded in the direction of creating immersive experiences of real environments. Combined with real-time and 3D rendering technologies, spatially referenced information about the earth’s surface can be presented in easy-to-understand visual formats, accessible to untrained users. 3D display technology for GIS is a growing field among commercial and government data-visualization service providers. The aim of data-visualization is to provide visually coherent, realistic and accurate representations of geospatial information. |
|
|
|
 |
|
|
|
a plug-in for the Autodesk VIZ or Discreet 3D Max, this program enables users to generate 3D city scenes and data from aerial photos
|
|
|
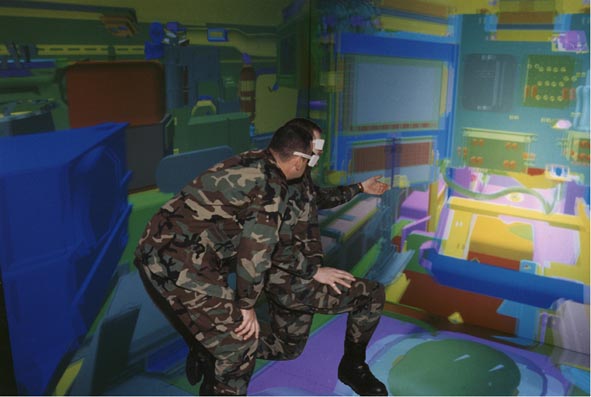
| Other companies, such as Fakespace Systems, offer more immersive environments, known as CAVEs (Cave Automatic Virtual Environments). Relegated to the realm of academics and scientific research during the past decade, CAVE technology is now trademarked and marketed by Fakespace for its line of virtual reality environments. These room-sized visualization tools combine multiple high-resolution, stereoscopic projectors and 3D computer graphics to create the illusion of a complete sense of presence in a virtual world. And Fakespace isn't the only company developing such immersive technologies. For instance, the University of Warwick, in partnership with VR Systems UK, has created Cybersphere, a 3.5-meter hemispherical dome in which a user stands in the center and high-powered projectors combine images on the dome's surface to create a 3D virtual reality. Other companies also offer their own versions of a CAVE. (4)
These ‘Automatic Virtual Environments,’ are currently being developed for widespread use in the mapping and exploration of ‘real’ space. Fakespace lists among its “markets,” the Design and Manufacturing, Energy, Government, Life Sciences, Museums and Entertainment, Research and Education sectors. (5) From Disneyland’s 3D mapping and simulation of areas of its California theme park for use in its Hong Kong affiliate, to adaptations for use by offshore oil and gas companies, such as Norsk Hydro, Phillips Petroleum and Shell Oil, CAVE environments reveal the flexibility characteristic of the most powerful new media applications. This flexibility is reflected by the company’s various clients. The software and hardware development processes foster close collaboration between governmental and corporate organizations, across wide ranging social sectors. For example, the Shell Oil exploration visualization program includes collaboration with the United States Air Force, and the Deere Company.
|
|
|
 |
|
 |
|
|
| 'Automatic Virtual Environments' are currently being developed for widespread use in the mapping and exploration of real space. |
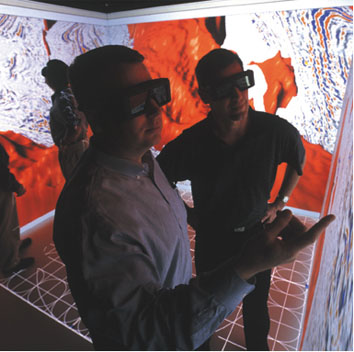
Visualization centers containing large curved screens supported by supercomputers were first used by larger geoscience industries, to allow scientists stationed in disparate locations to meet and review data.
|
|
| Data visualization systems are not limited to the mapping and simulation of real spaces, but often require the creation of whole new environments to support their proper deployment. Visualization centers containing large curved screens supported by supercomputers were first used by larger geoscience industries, to allow scientists stationed in disparate locations to meet and review data difficult to fully grasp individually. Today declining costs and increasingly powerful computers are beginning to make visualization rooms the industry standard: |
|
|
For Pioneer and Nexen, determining the need for a visualization room was an evolving process. “We evaluated the state of visualization every other year,” said Carol Tessier, director of Engineering and Enterprise Solutions for Pioneer in Dallas, Texas…Declining cost, smaller and more powerful computers, and advanced software are enabling more companies to drive large, interactive and stereoscopic datasets on inexpensive PC and Linux computers. Pioneer considered adopting visualization a few years ago after larger company partners using the technology espoused the value of collaboration. It wanted full value out of its 3-D seismic data as well as to better utilize all resources in decision-making. While information may be shared in advance of a meeting, a visualization room may be the first place everyone sees their work as a cohesive dataset. According to Tessier, “Our technical teams will study the data for weeks and then, in a meeting, try to get others to understand what they have thought through over the last few weeks in a couple of hours. Visualization is a tool to help others catch up more quickly." (6) |
|
| Visualization rooms, then, are themselves specially designed spaces of collaboration and sharing, in which those responsible for ‘decision-making’ might conceptually grasp the world outside. By definition, the visualization room is a ‘between-space’ hugging the boundary separating real from virtual, in which actions which might (literally, in some cases) change the face of the real earth are imagined. But the question remains: What is the nature of the world that is being imagined, or possibly, transformed? |
|
|
(1) Ryan Bishop and Gregory Clancey, “The City as Target, or Perpetuation and Death,” in Post-Colonial Urbanism: Southeast Asian Cities and Global Processes, Ryan Bishop, John Phillips and Wei Wei Yeo eds. (New York & London: Routledge, 2003).
(2) John Harwood, “The White Room: Eliot Noyes and the Logic of the Information Age Interior,” in Grey Room (MIT Press: Volume 12, Summer 2003)
(3) Ibid.
(4) Jim Engelhardt, “The 3D Future is Now,” Geospatial Solutions, Oct 1. 2004.
(5) http://www.fakespace.com.
(6) Jeffrey Brum, “Realizing the value of visualization centers,” Hart’s E&P Magazine, January 2005. Jeffrey Brum is Vice President of Marketing and Business Development at Fakespace Systems, Inc.
|
|
|
|
|
|
|
|
|
|
|
|
|
|
|
|
|
|
|
|
|
|
|
|
|
|
|
|
|
|
|
|
|
|