Plasma Turbulence - from my Master's thesis
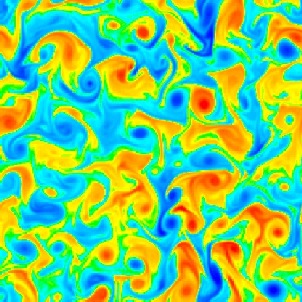
Here is a snapshot of a simulation of two-dimensional turbulence from my Master's thesis. It shows particle density fluctuations in a magnetized plasma on a color scale where red indicates positive density perturbations (i.e. the local plasma density in that particular region is higher than the average density in the plasma) and blue indicates negative density perturbations (low density regions). The turbulence arises because the plasma has a background density gradient (in the horizontal direction in the simulation pictures seen here) so that there is a net pressure gradient force that tends to move particles to regions with lower background density. However, only the deviations from this average are shown on these pictures so the increase in density from left to right cannot be seen here because it is part of the "background density".
One of the things I looked at in my Master's thesis is how particles are transported by the turbulent flow, in particular how two particles, iniatially very close together, separate from each other in the chaotic motion of the plasma. A simple linearized model of this phenomenon shows that the plasma flow can be divided into two distinctly different regions, according to the sign of the following quantity:
Q=0.25(strain2-rotation2)
In regions where Q is positive, the velocity flow is dominated by strain (or deformation), and particles are expected to separate from each other exponentially. In regions where Q is negative, rotation dominates, and according to the linearized model two particles right next to each other will stay close to each other. The distance between them will oscillate sinusoidally but will not grow on average.
It turns out that the quantity Q is known in hydrodynamics as the "Weiss parameter", and it is an excellent tool to detect vortex structures in the turbulence, and to visualize them and their interactions. This is so because vortices are strongly rotational in their center regions and have strong shear at the edges, so that Q is strongly negative in the center of a vortex and strongly positive around the edges of the vortex. Thus, if we plot Q on the same color scale as above, i.e. blue indicates strongly negative Q values and red indicates strongly positive values, a vortex will show up clearly as a circular blue region with a red edge around it, as you can see by moving the cursor in and out of the picture below (allow some time to load images first time you move cursor into the picture):
You can download two mpeg movies showing how the turbulence evolves in time in a situation where vortices have formed naturally in the turbulence. The first movie (mpeg density movie 631 K) shows the flow of the density fluctuations, whereas the second one (mpeg Weiss field movie 378 K) shows how the Weiss field evolves in time for the same simulation.
The simulations show how the Weiss field focuses on the vortices and their interactions. In the Weiss field it is clear that the vortices interact, pushing and swinging each other around. It is also clear that there are many of them, more than twenty in this simulation. Small vortices are created and destroyed dynamically whereas the large ones seem to be very stable. All of this is much less obvious in the density fluctuation field.
Vortical structures and turbulence in general play an important role in plasma physics, as well as in other fields of science. Drift wave turbulence in fusion plasma experiments causes enhanced transport of particles and energy across the magnetic field lines in current tokamak experiments, and so degrades the confinement necessary to achieve ignition of the fusion processes. A better understanding of plasma turbulence, coherent structures, and their influence of this enhanced transport may eventually enable us to suppress this effect and thus move a significant step further towards reaching thermonuclear ignition.