Synthesized Wave
wave.wav
|
|
|
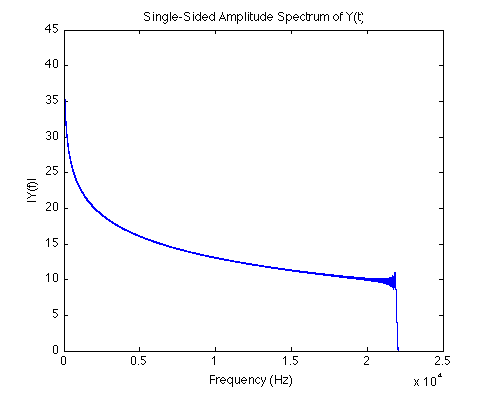
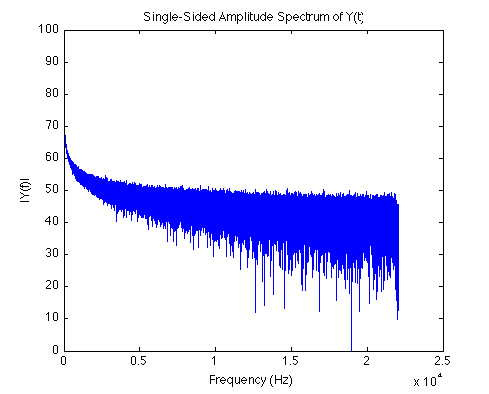
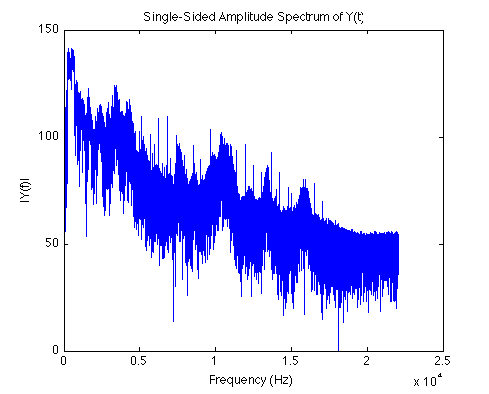
displayDFT(wave,44100) The spectrum indicates frequencies existing from 20Hz to 22kHz, as expected. |
quickSpectrogram(wave, 4096, 4096, 0); The peak of the magnitude curve for each window is quite narrow and precise for lower frequencies, but becomes ambiguously large for higher frequencies, due to the large window size. |
|
|
|
quickSpectrogram(wave, 256, 4096, 0); The opposite effect occurs for a window size that is too small. Peak detection is less precise for lower frequencies. |
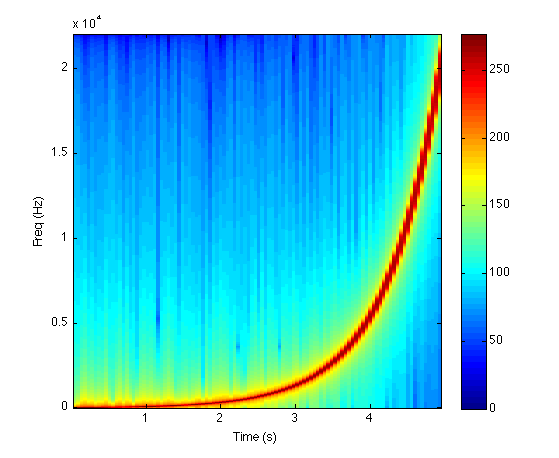
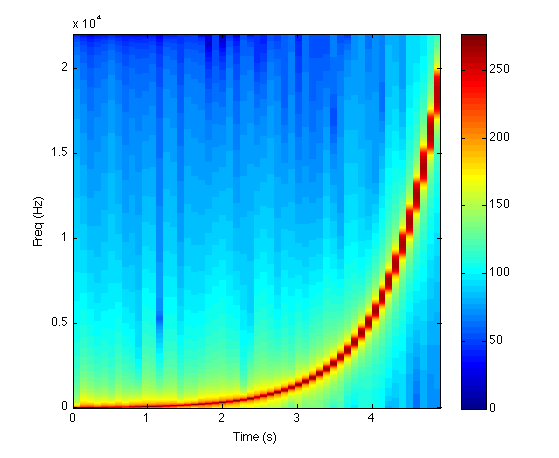
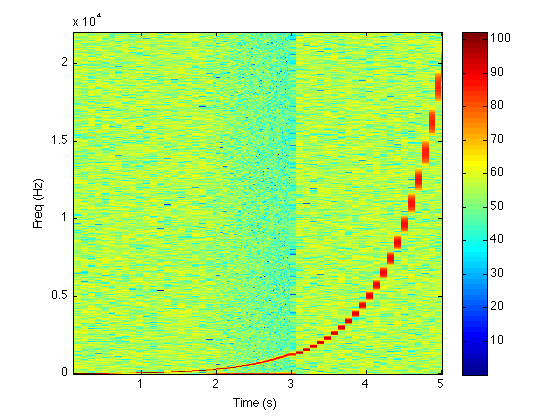
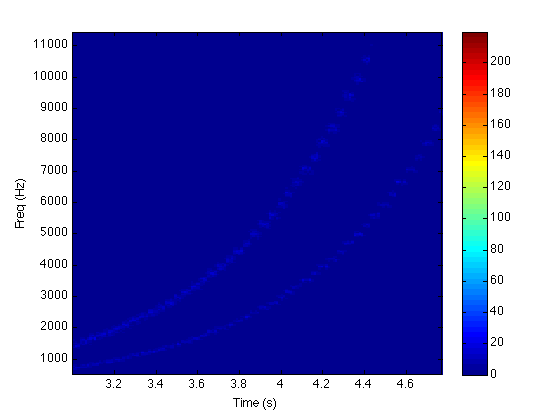
varWinSpectrogram(wave, 44100, 0,0); The initial low-resolution, non-overlapping spectrogram used to estimate pitch for the variable window spectrogram |

|
|
|
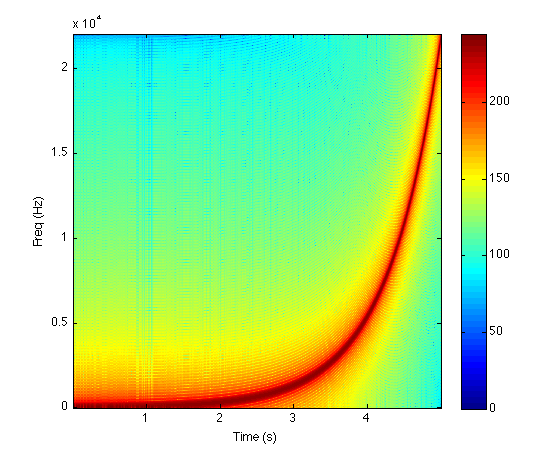
varWinSpectrogram(wave, 44100, 0,0); The variable window spectrogram uses larger windows for lower frequencies, and smaller windows for higher frequencies. The peak width is approximately constant throughout the spectrum hpsofoff is false because the wave has no harmonics, and isNoisy is false because the wave is noise-free. |
[S F T Y] = quickSpectrogram(wave,1000,1024,0); The waveform is pitch-corrected to a half-step scale. This is depicted by the discrete, equal-width blocks of pitch in the spectrogram. |
|
|
|
[S F T Y] = quickSpectrogram(wave,1000,1024,0); The waveform is pitch-corrected to C-major (though wave2 starts on A-440 so C-major will sound like A-minor), however the spacing of pitch blocks and the sound of the waveform both indicate that the wave was corrected to a pentatonic scale instead (the inverse of the C-major scale.) This could indicate a problem with compareToPitches(), though it worked as expected for smaller test cases. This should be further explored. |
A closer look at the last image. wave2 files are slower so individual pitches are easier to distinguish
waveSemi.wav waveCmajor.wav wave2Semi.wav wave2Cmajor.wav |
Synthesized Wave, with Noise Added
noisyWave.wav
|
|
|
displayDFT(noisywave,44100) |
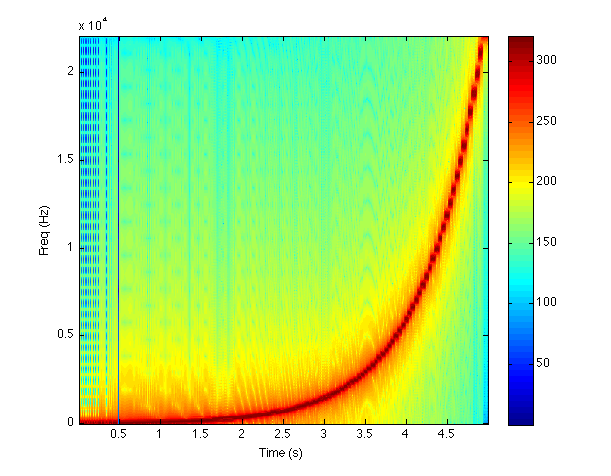
varWinSpectrogram(noisywave,44100,0,0); With the added noise, varWinSpectrogram() has difficulty calculating correct window sizes. |
|
|
|
A close-up of the initial spectrogram reveals a large DC component to the wave, throwing off approximate pitch calculations. |
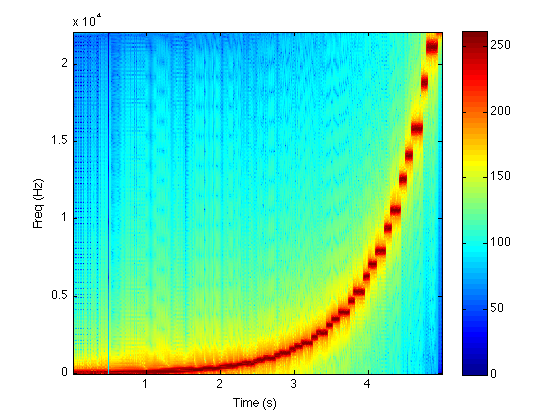
varWinSpectrogram(noisywave,44100,0,1); With the high-pass filter turned on, varWinSpectrogram functions as normal. The rest of the noise does not interfere with pitch detection much. The scale of this image was chosen to emphasize the fact that the low-frequency components of the signal are still intact. |
|
noisyWaveSemi.wav noisyWave2Semi.wav |
|
[S F T Y] = quickSpectrogram(noisywave,1000,1024,0); For some reason, the normal spectrogram shows no information about the pitch-corrected noisy wave, but with HPS turned on, the discrete pitches are just barely visible. The double curve gives off the misleading impression that the original wave contained harmonics, but this is just an artifact due to noise being constant (in a statistical sense) at every frequency. Note that HPS was not used in the first quickSpectrogram() as, again, the wave has no harmonics. |
Real Audio Wave
glissando.wav
|
|
|
displayDFT(glissando,44100) |
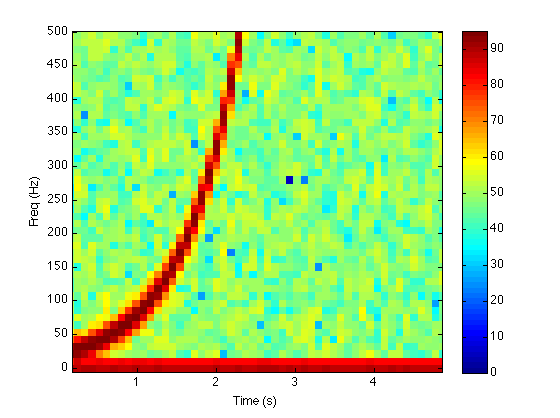
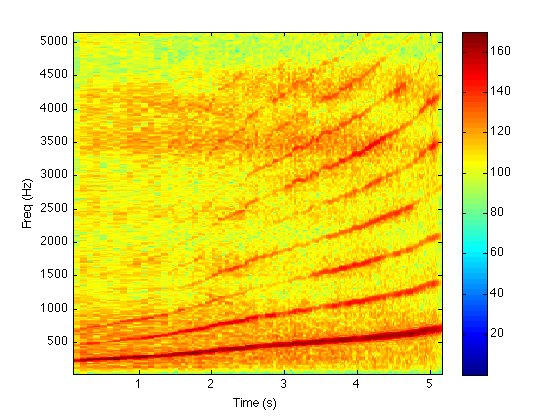
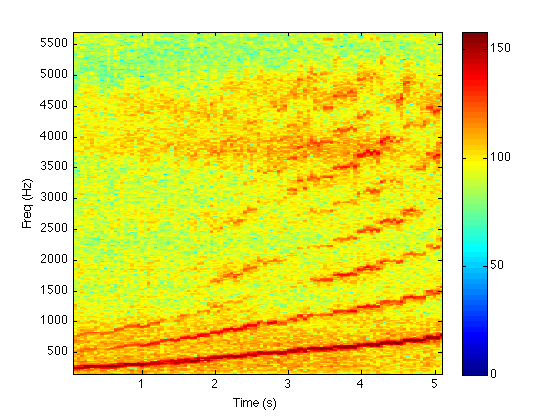
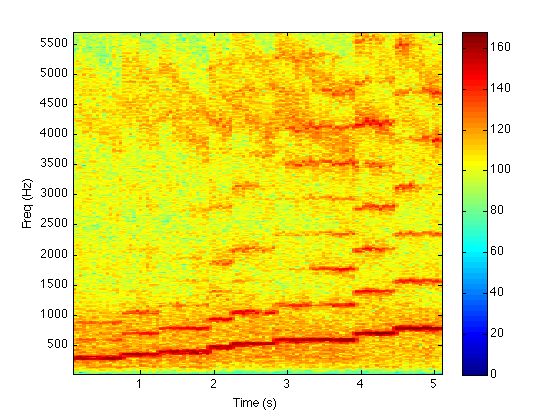
varWinSpectrogram(glissando,44100,0,0); Most of the frequency content is located between 0 and 5000Hz. The spectrogram provides a nice view of the voice's harmonics. |
|
|
|
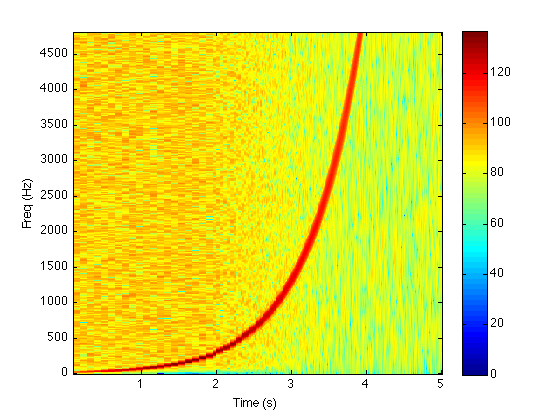
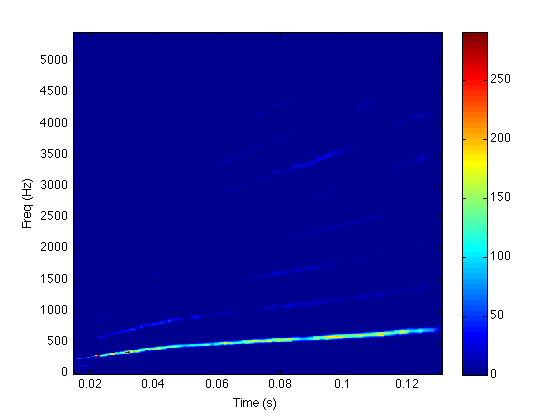
varWinSpectrogram(glissando,44100,1,0); The fundamental frequency was already pronounced enough in the first spectrogram, but the HPS accentuates it further. |
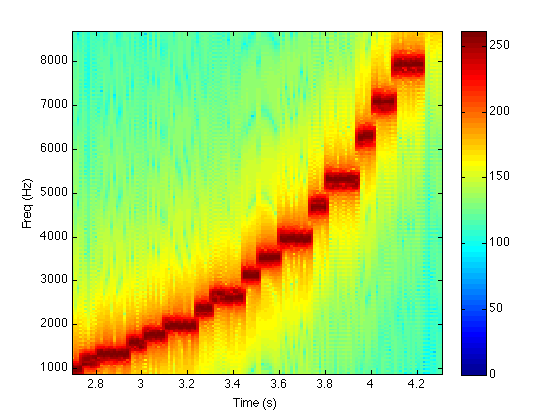
[S F T Y] = quickSpectrogram(glissando,4000,4096,1); The harmonics do indeed get scaled by the correct amount. |
|
voiceSemi.wav voiceCminor.wav |
|
[S F T Y] = quickSpectrogram(glissando,4000,4096,1); Wave2 starts on A-440, but will be pitch corrected to A-flat or B-flat, so that C-minor...will not sound like C-minor. However, once again, it seems as though the signal is being pitch corrected to the scale that is the inverse of C-minor :( |
Future Steps