El Nino & La Nina
ENSO indices, upper-ocean temperature, and their relationship to global surface temperature.
Recent ENSO and Global Temperature
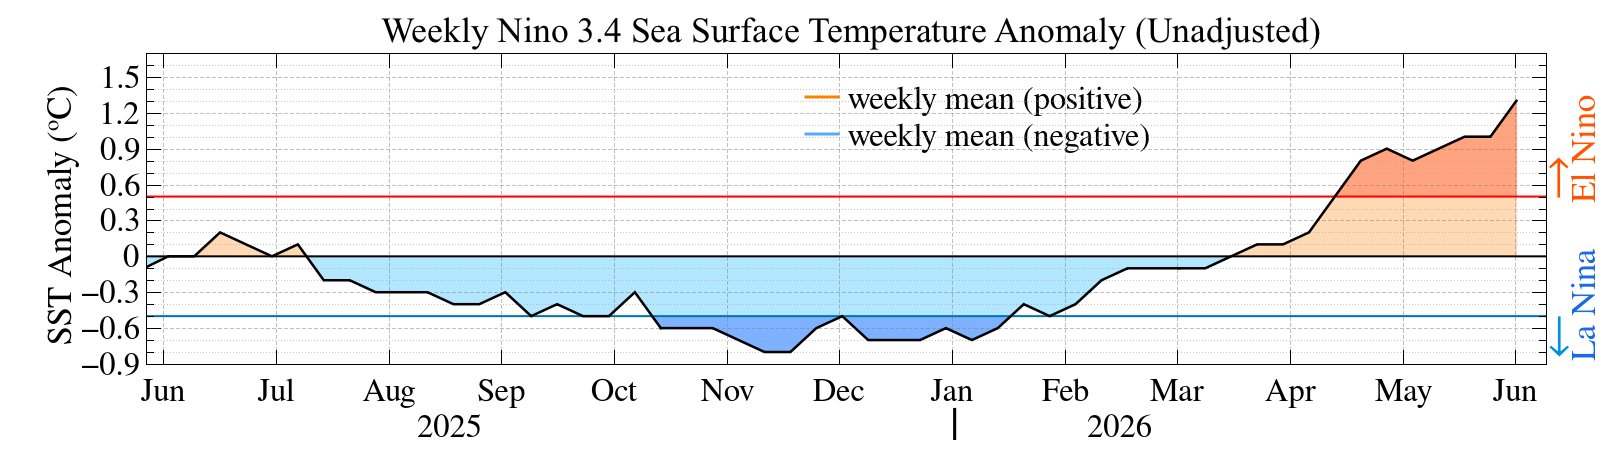
Weekly Nino 3.4 Sea Surface Temperature (unadjusted).
Anomalies relative to 1991-2020 base period, in the region 5ºN-5ºS, 170-120ºW.
Figure available as
PDF
.
Data: 4 Jun 2025 - 8 Jul 2026.
Data source: ref. [1a].
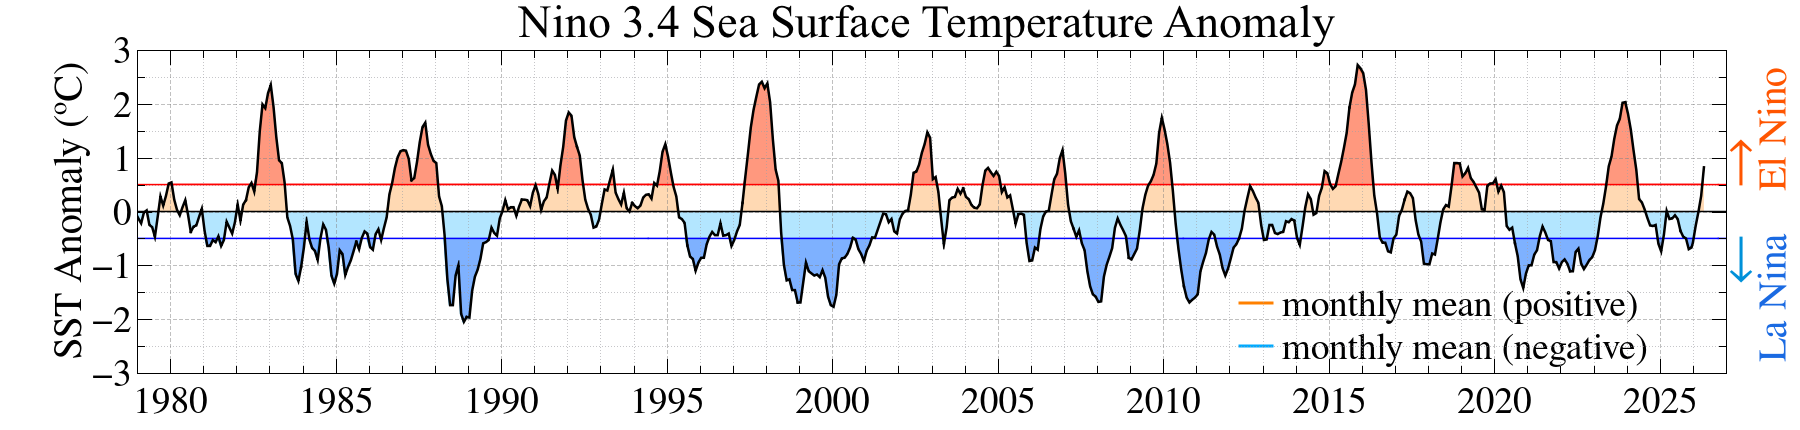
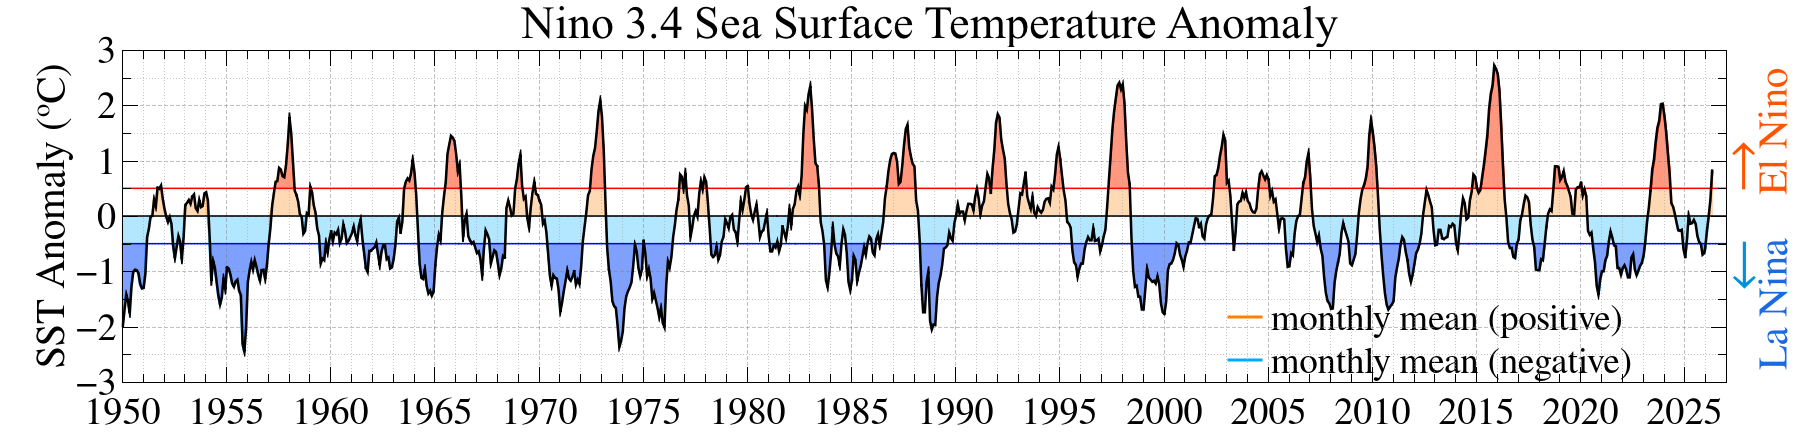
Nino 3.4 sea surface temperature (Jan 1979 – Jun 2026).
Monthly mean SST anomalies relative to the 1991–2020 base period, in the region 5ºN-5ºS, 170-120ºW.
Figure available as
PDF
.
Data through Jun 2026. Data source:
ref. [1b].
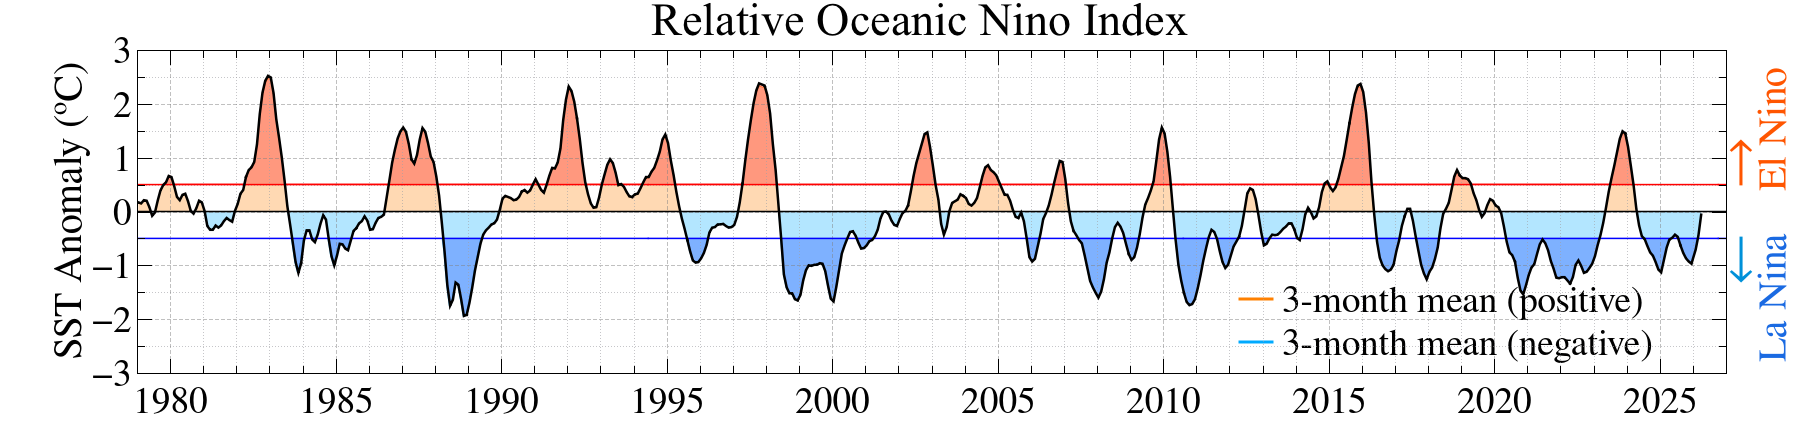
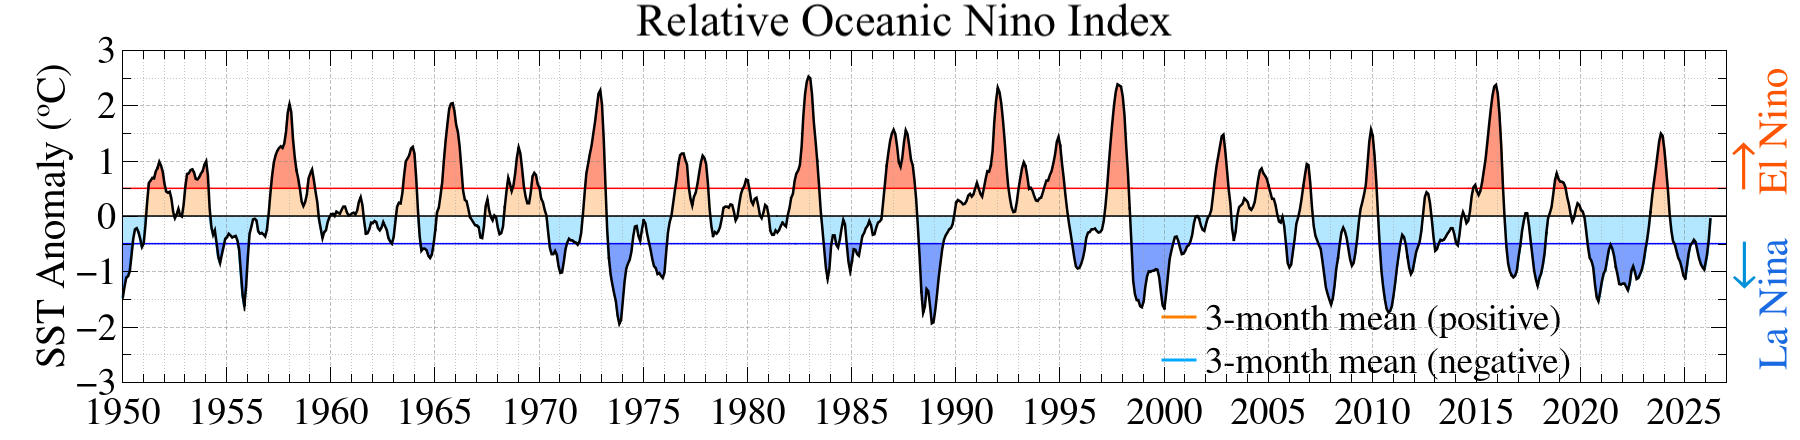
Relative Oceanic Nino Index (RONI, DJF 1979 – AMJ 2026).
3-month running mean SST anomalies relative to the 1991–2020 base period, in the region 5ºN-5ºS, 170-120ºW.
Figure available as
PDF
.
Data through AMJ 2026. Data source:
ref. [3].
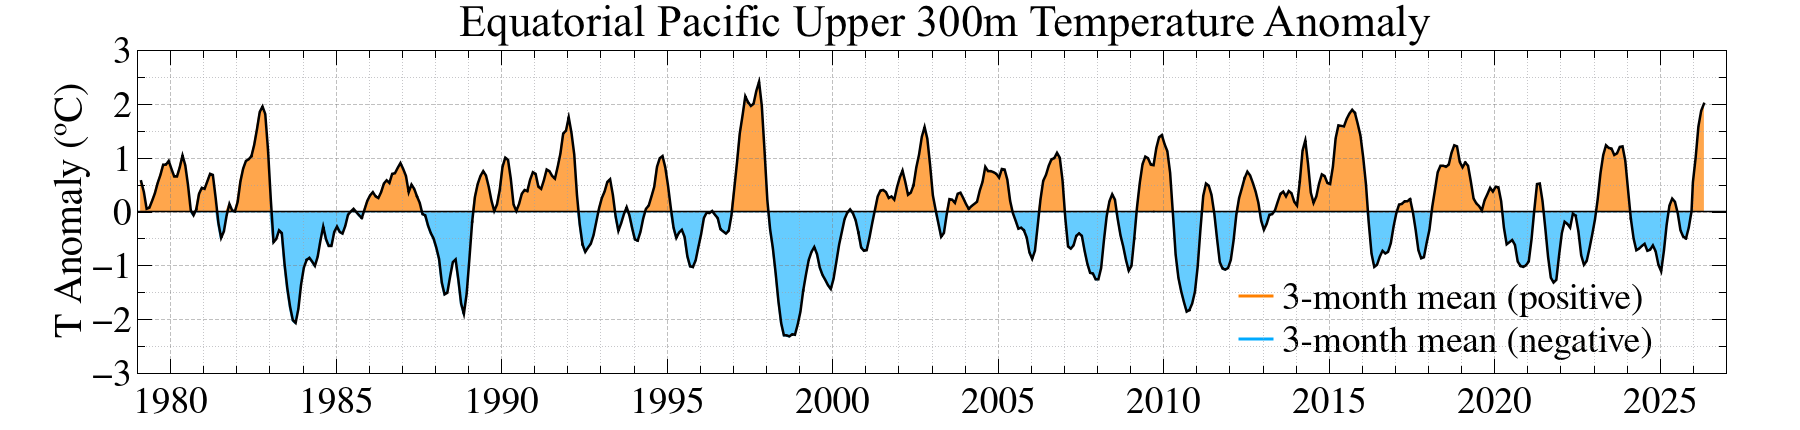
Equatorial Pacific upper 300 m temperature (180°E–100°W, Jan 1979 – Jun 2026).
3-month running mean temperature anomalies relative to the 1991–2020 base period.
Figure available as
PDF
.
Data through Jun 2026. Data source:
ref. [2].
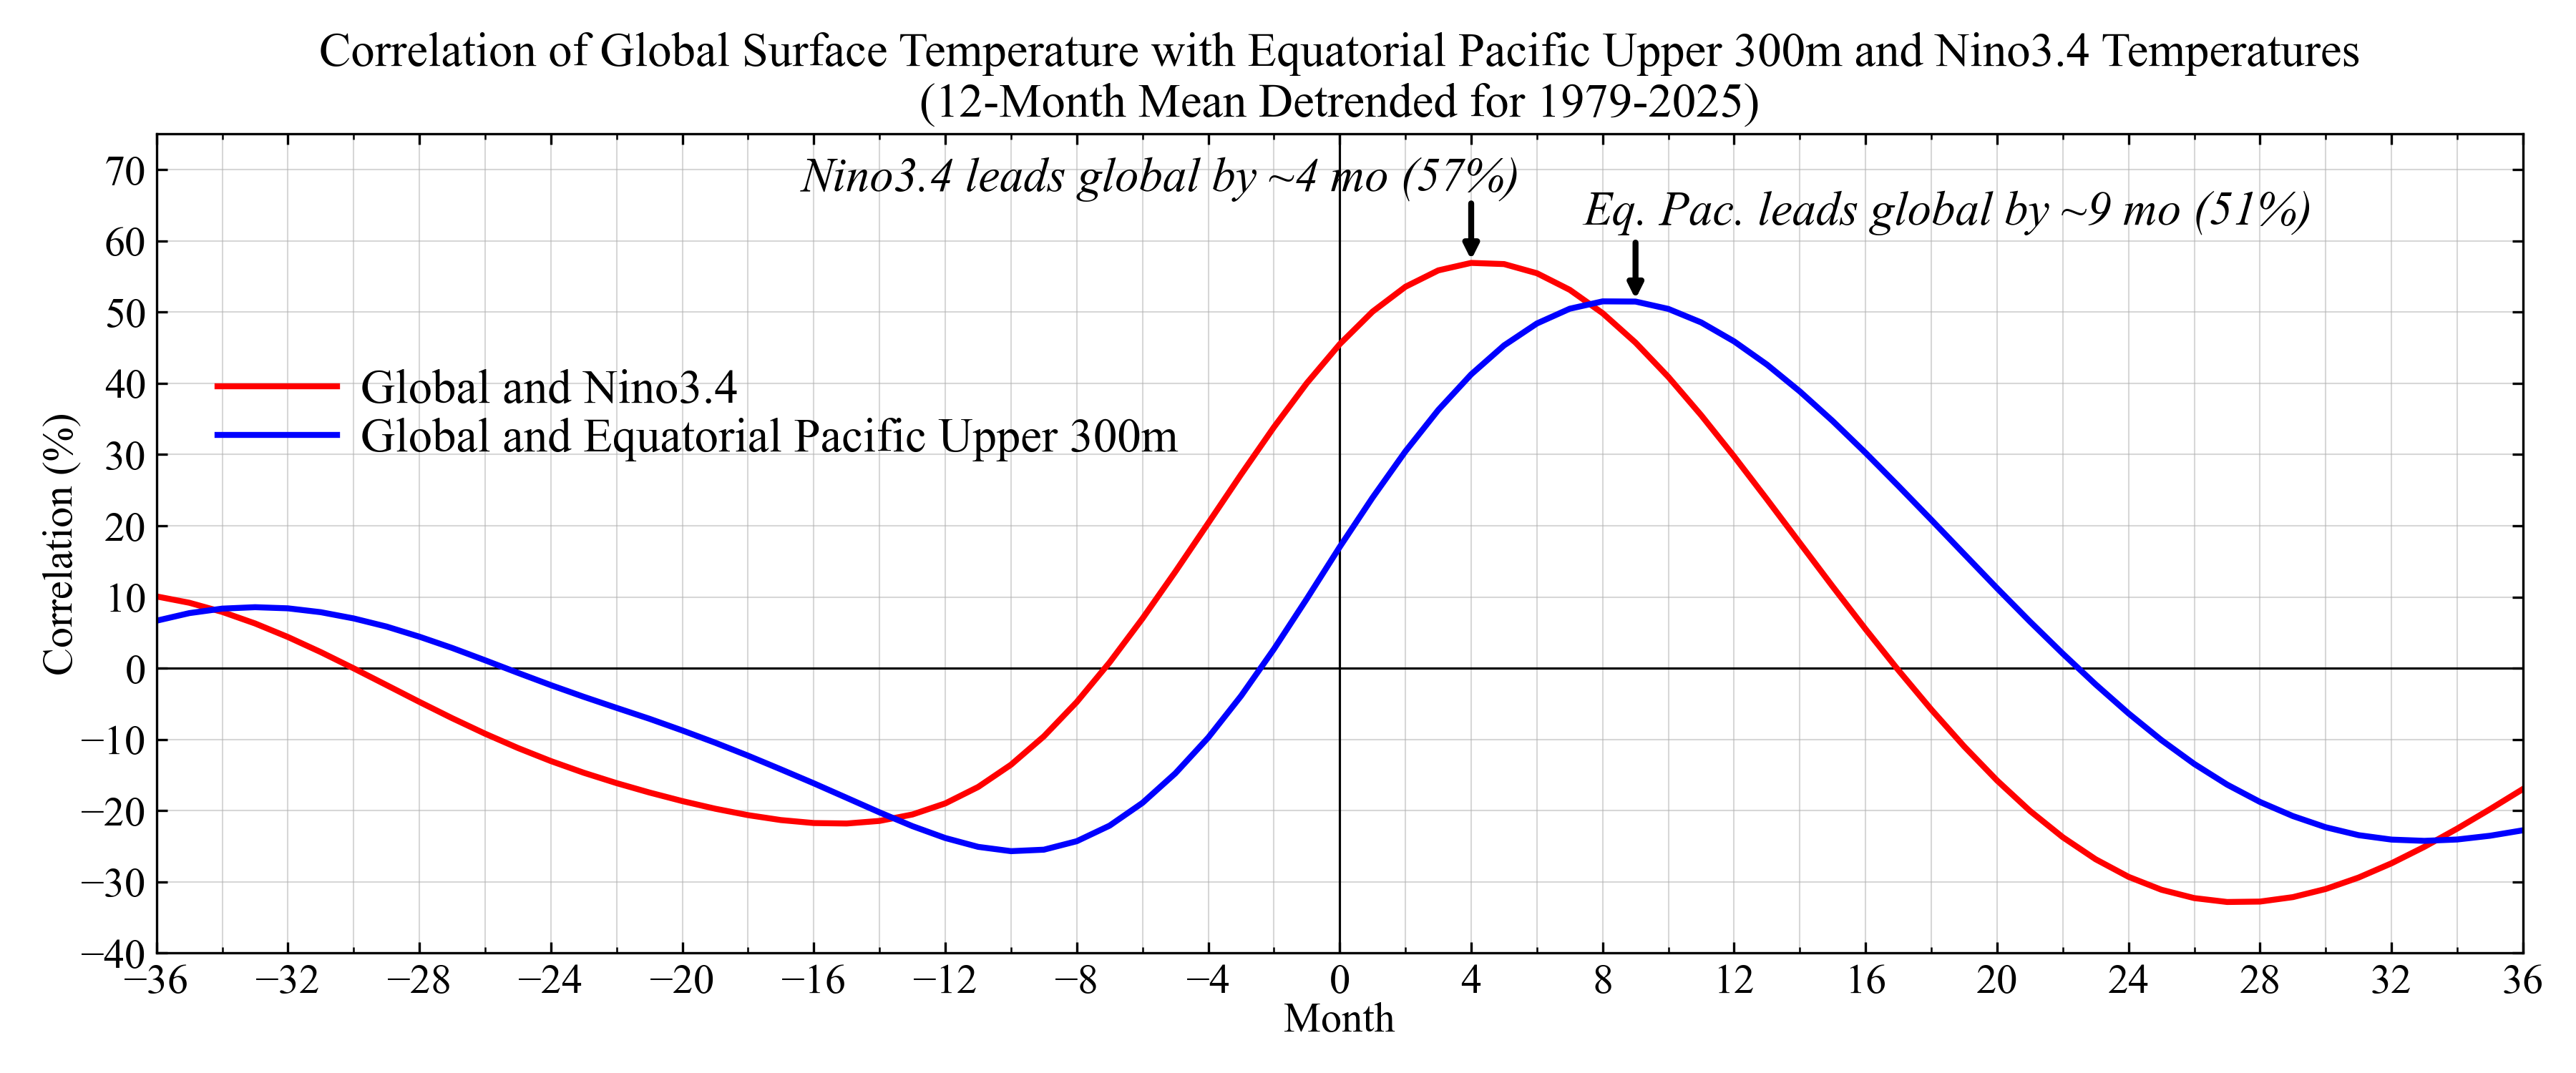
Correlation of global surface temperature with Nino 3.4 and upper 300 m temperature.
Lead–lag correlations based on detrended 12-month running means for 1979–2025.
Figure available as
PDF
.
Data through Jun 2026. Peak correlations occur at about 4 months for Nino3.4 and about 9 months for upper 300 m temperature. Underlying data sources:
ref. [4],
ref. [1b],
ref. [2].
Extended ENSO Indices (1950–Present)
Nino 3.4 sea surface temperature (Jan 1950 – Jun 2026).
Monthly mean SST anomalies relative to the 1991–2020 base period, in the region 5ºN-5ºS, 170-120ºW.
Figure available as
PDF
.
Data through Jun 2026. Data source:
ref. [1b].
Relative Oceanic Nino Index (RONI, DJF 1950 – AMJ 2026).
3-month running mean SST anomalies relative to the 1991–2020 base period, in the region 5ºN-5ºS, 170-120ºW.
Figure available as
PDF
.
Data through AMJ 2026. Data source:
ref. [3].
ENSO and Global Temperature Relationships
Comparison of global surface temperature with Nino3.4 and equatorial Pacific upper-300 m temperature,
based on detrended 12-month running means for selected detrending periods.
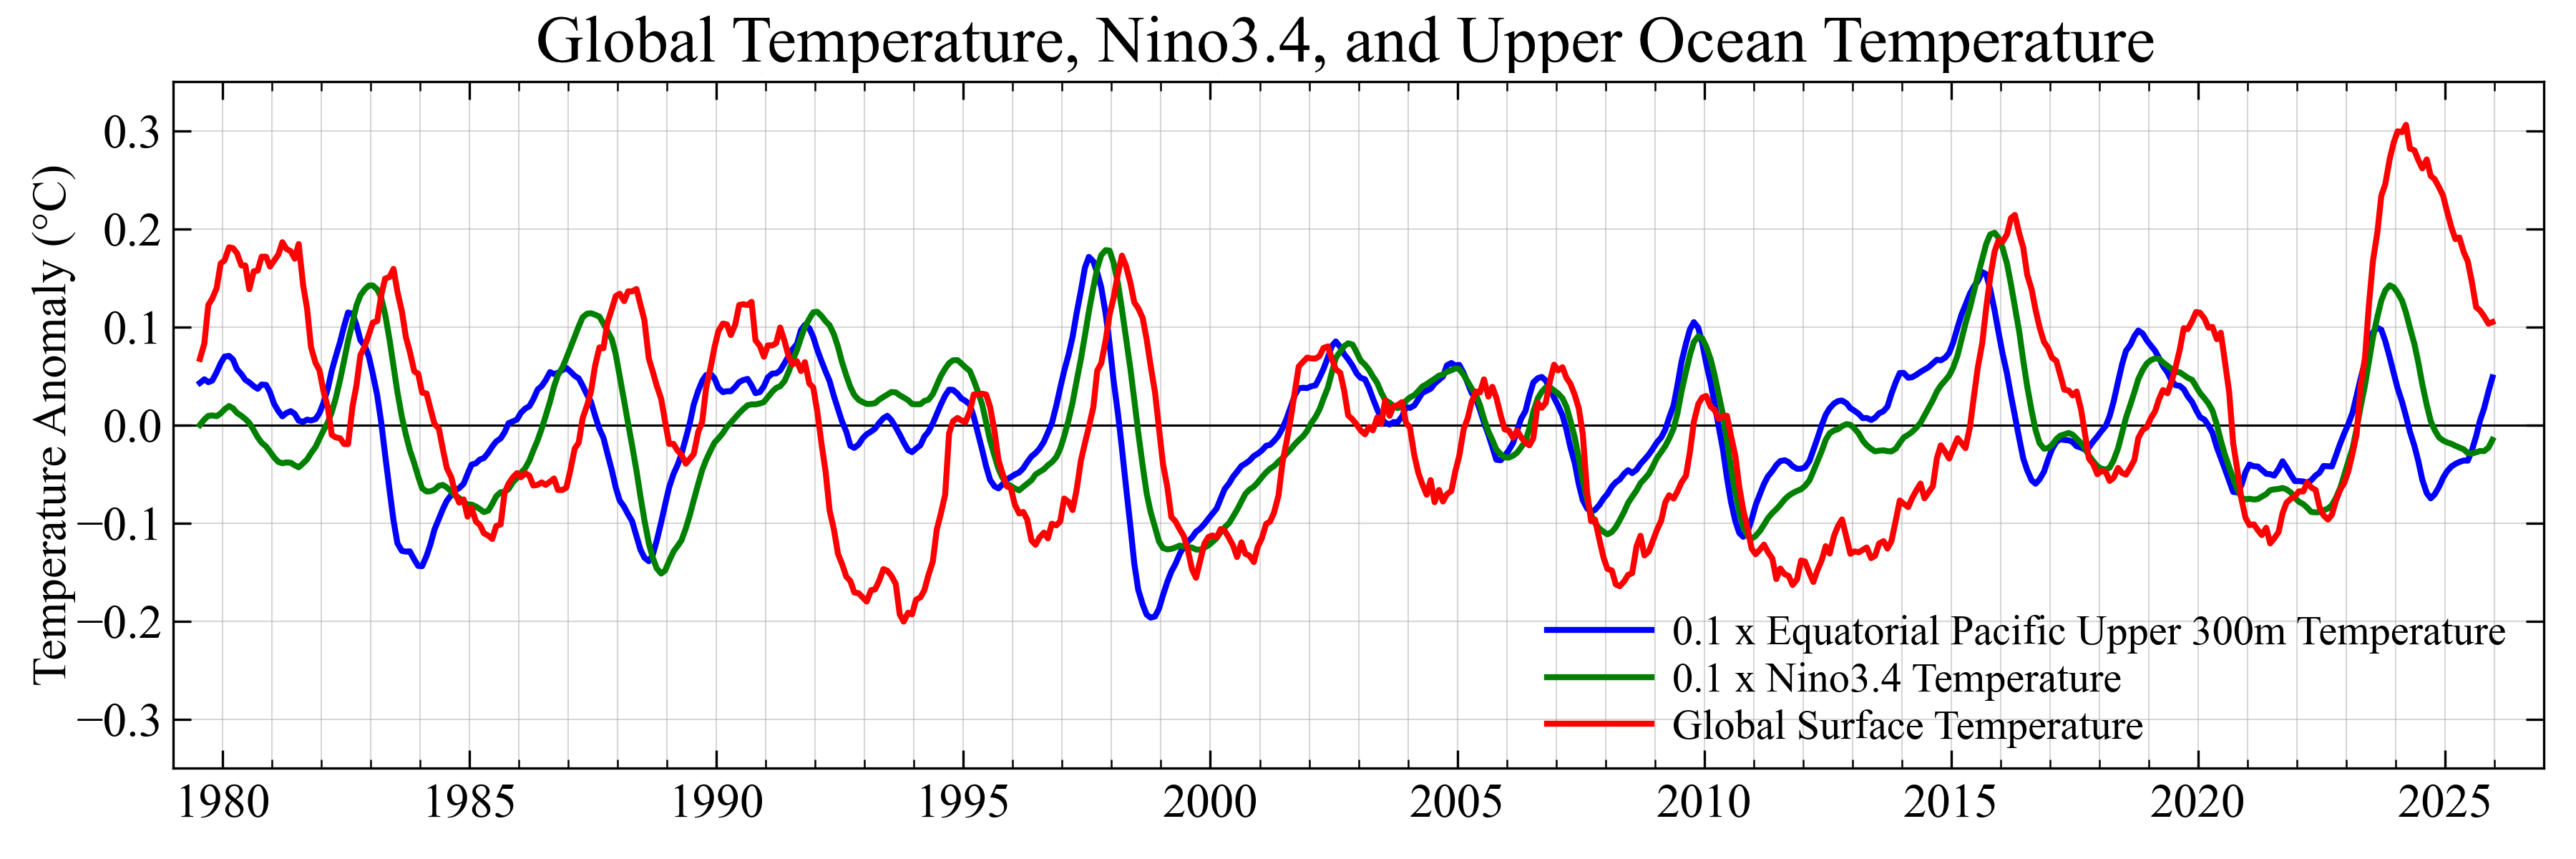
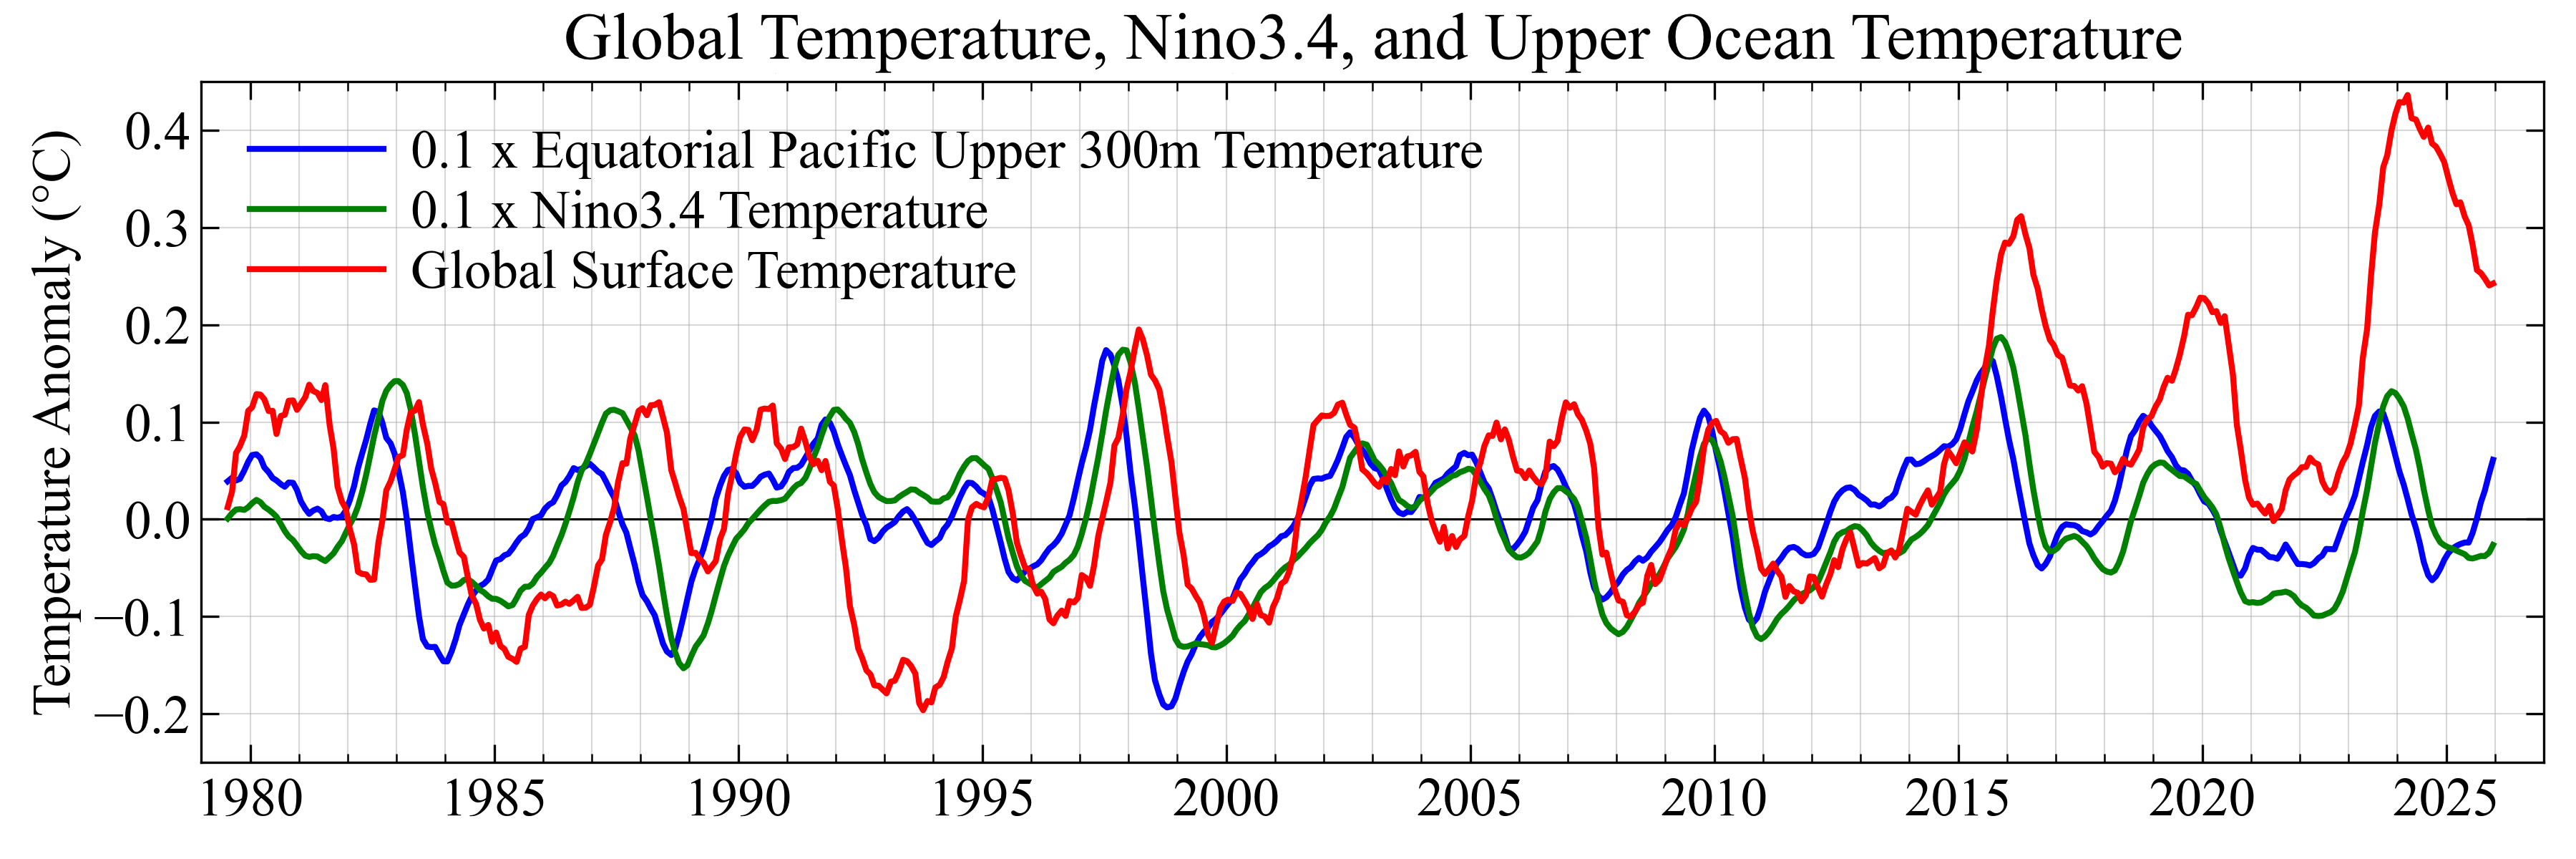
Global surface temperature, Nino3.4, and equatorial Pacific upper 300 m temperature (detrended for 1979–2025).
Detrended 12-month running means, with Nino3.4 and upper-300 m temperature scaled by 0.1.
Figure available as
PDF
.
Data through Jun 2026. Underlying data sources:
ref. [4],
ref. [1b],
ref. [2].
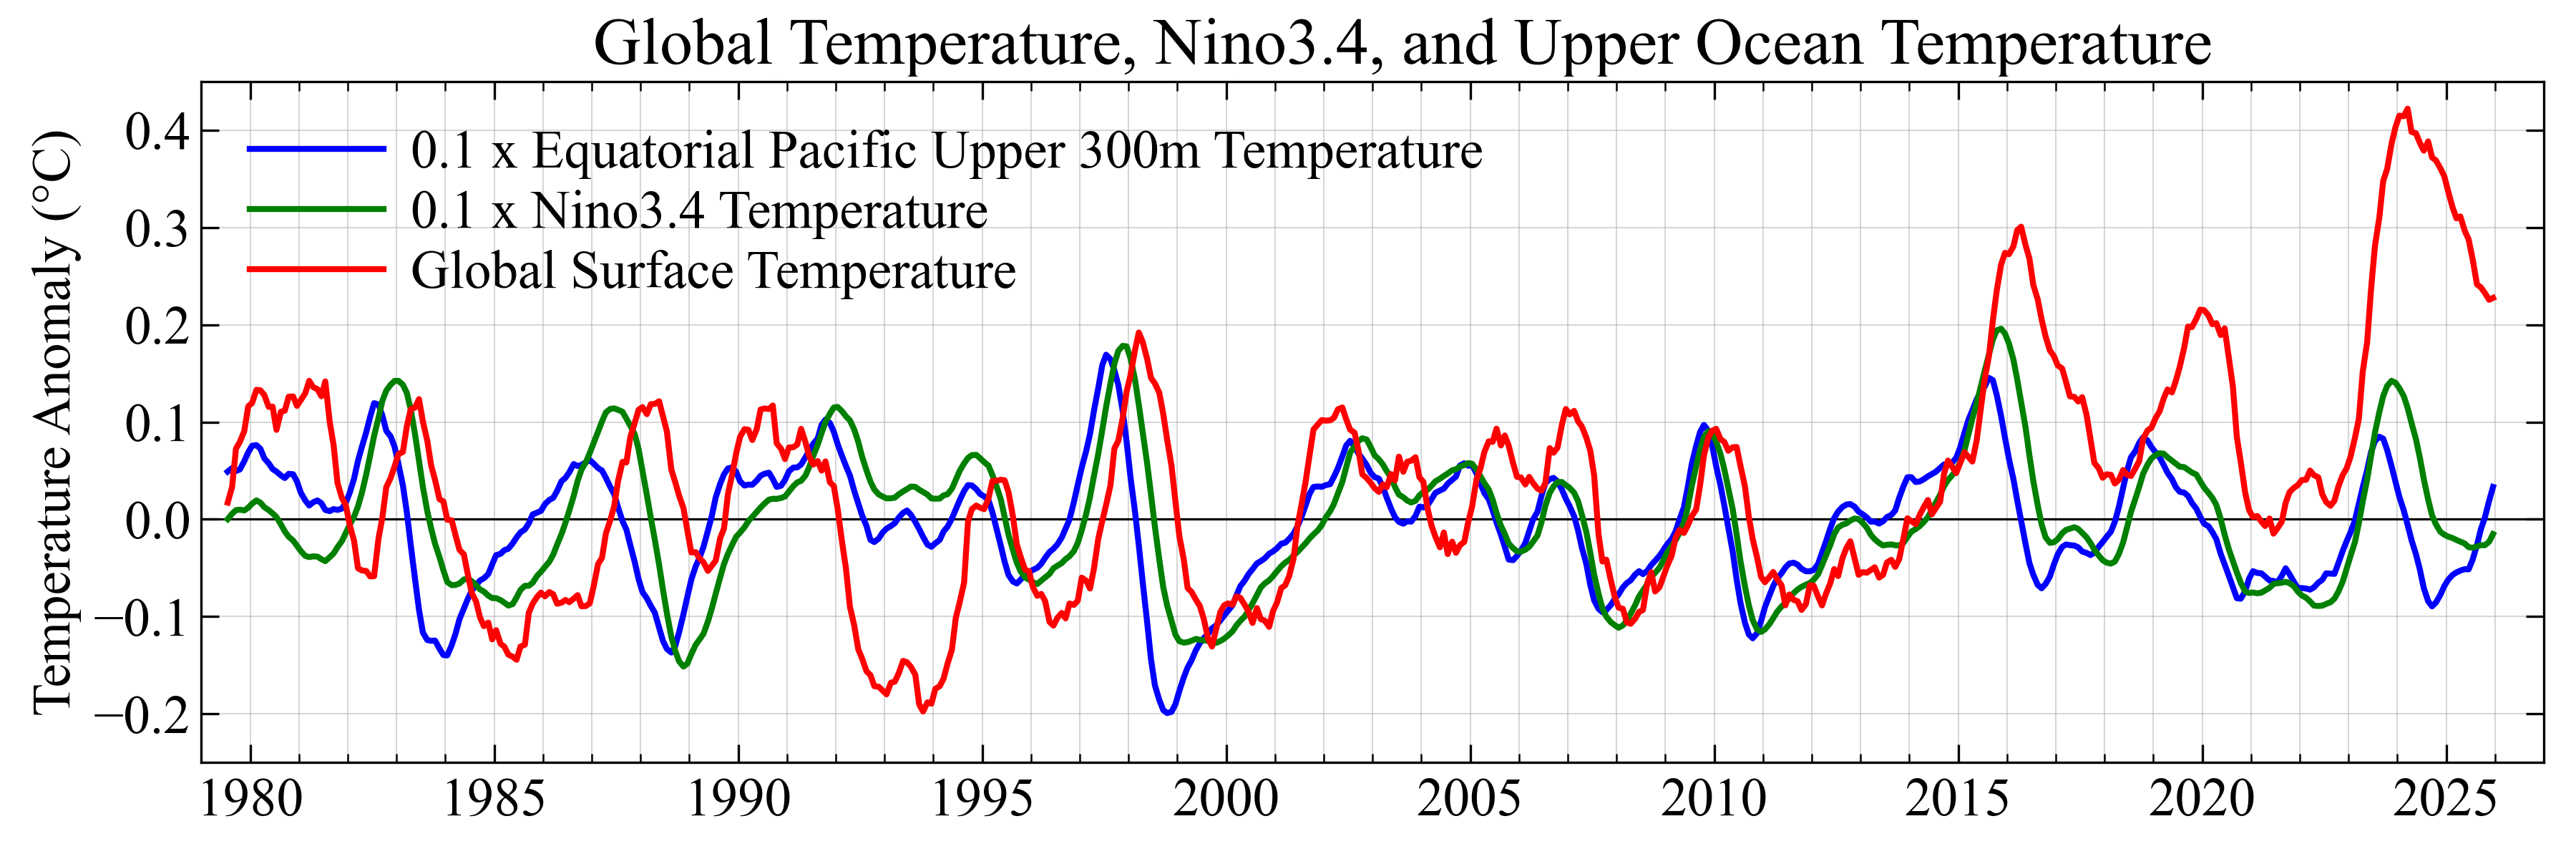
Global surface temperature, Nino3.4, and equatorial Pacific upper 300 m temperature (detrended for 1979–2005).
Detrended 12-month running means, with Nino3.4 and upper-300 m temperature scaled by 0.1.
Figure available as
PDF
.
Data through Jun 2026. Underlying data sources:
ref. [4],
ref. [1b],
ref. [2].
Global surface temperature, Nino3.4, and equatorial Pacific upper 300 m temperature (detrended for 1979–2015).
Detrended 12-month running means, with Nino3.4 and upper-300 m temperature scaled by 0.1.
Figure available as
PDF
.
Data through Jun 2026. Underlying data sources:
ref. [4],
ref. [1b],
ref. [2].
Additional versions for other detrending periods are available on the
More Figures page.
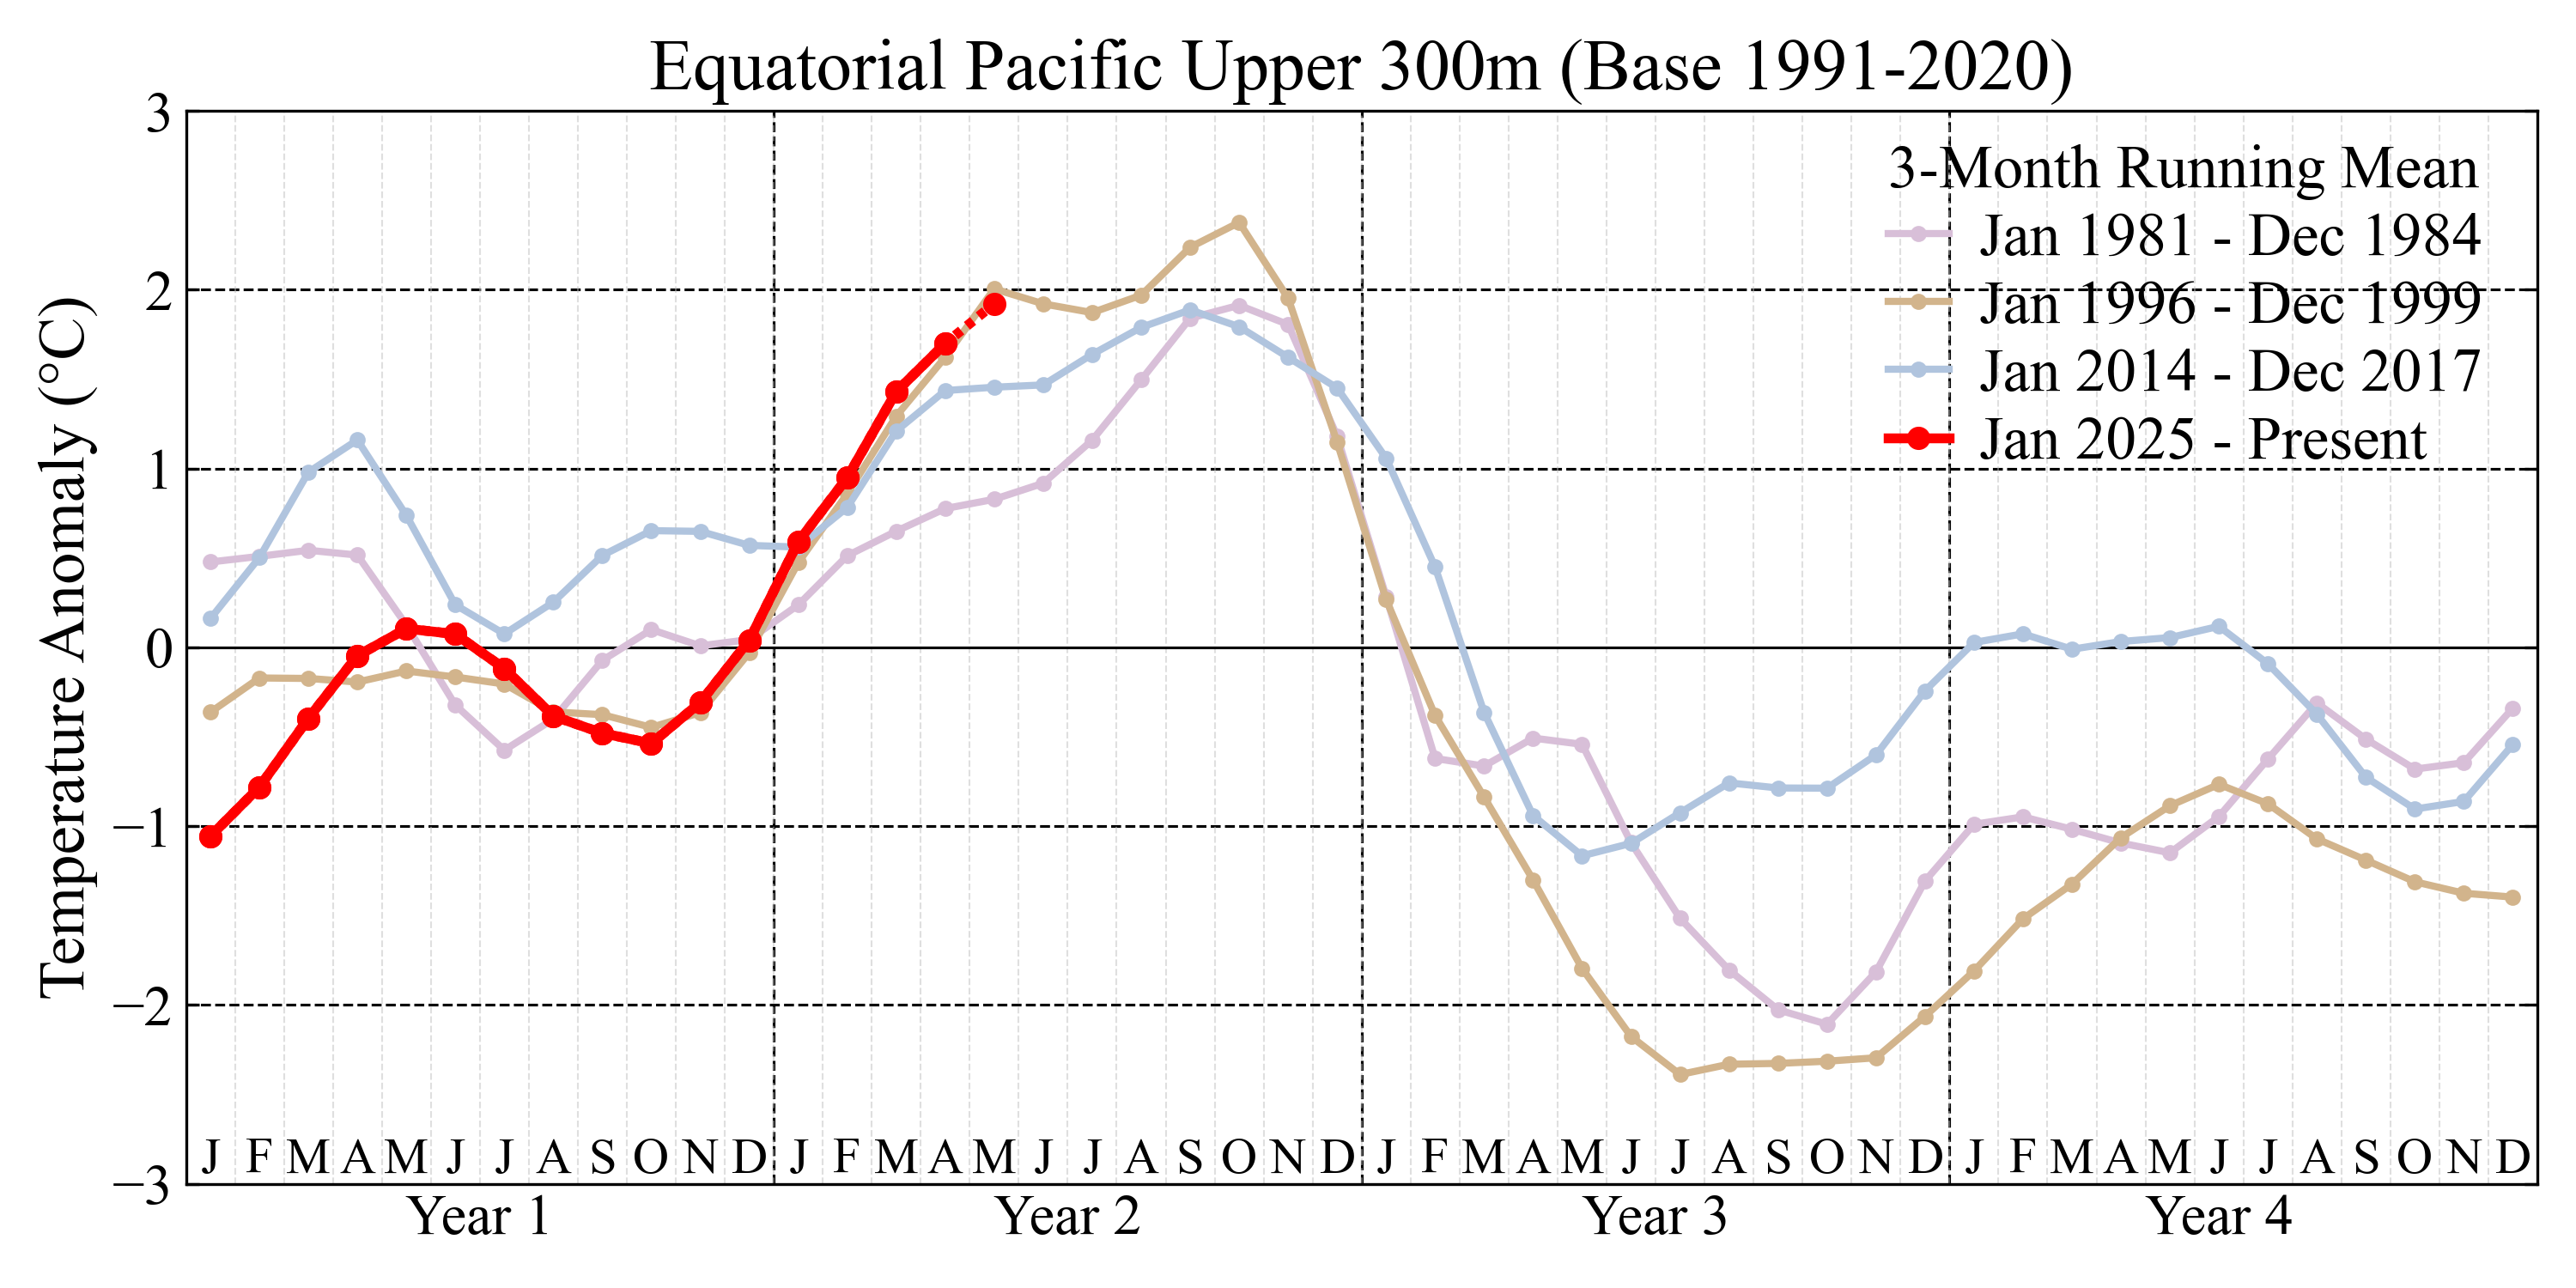
ENSO Cycle Comparisons
Comparison of the present ENSO cycle with selected past El Nino periods
using Nino3.4 SST, Nino3.4 RONI, and equatorial Pacific upper-300 m temperature anomalies.
Curves are based on three-month running means and compare the present ENSO cycle
with selected past El Nino periods over equivalent portions of each cycle.
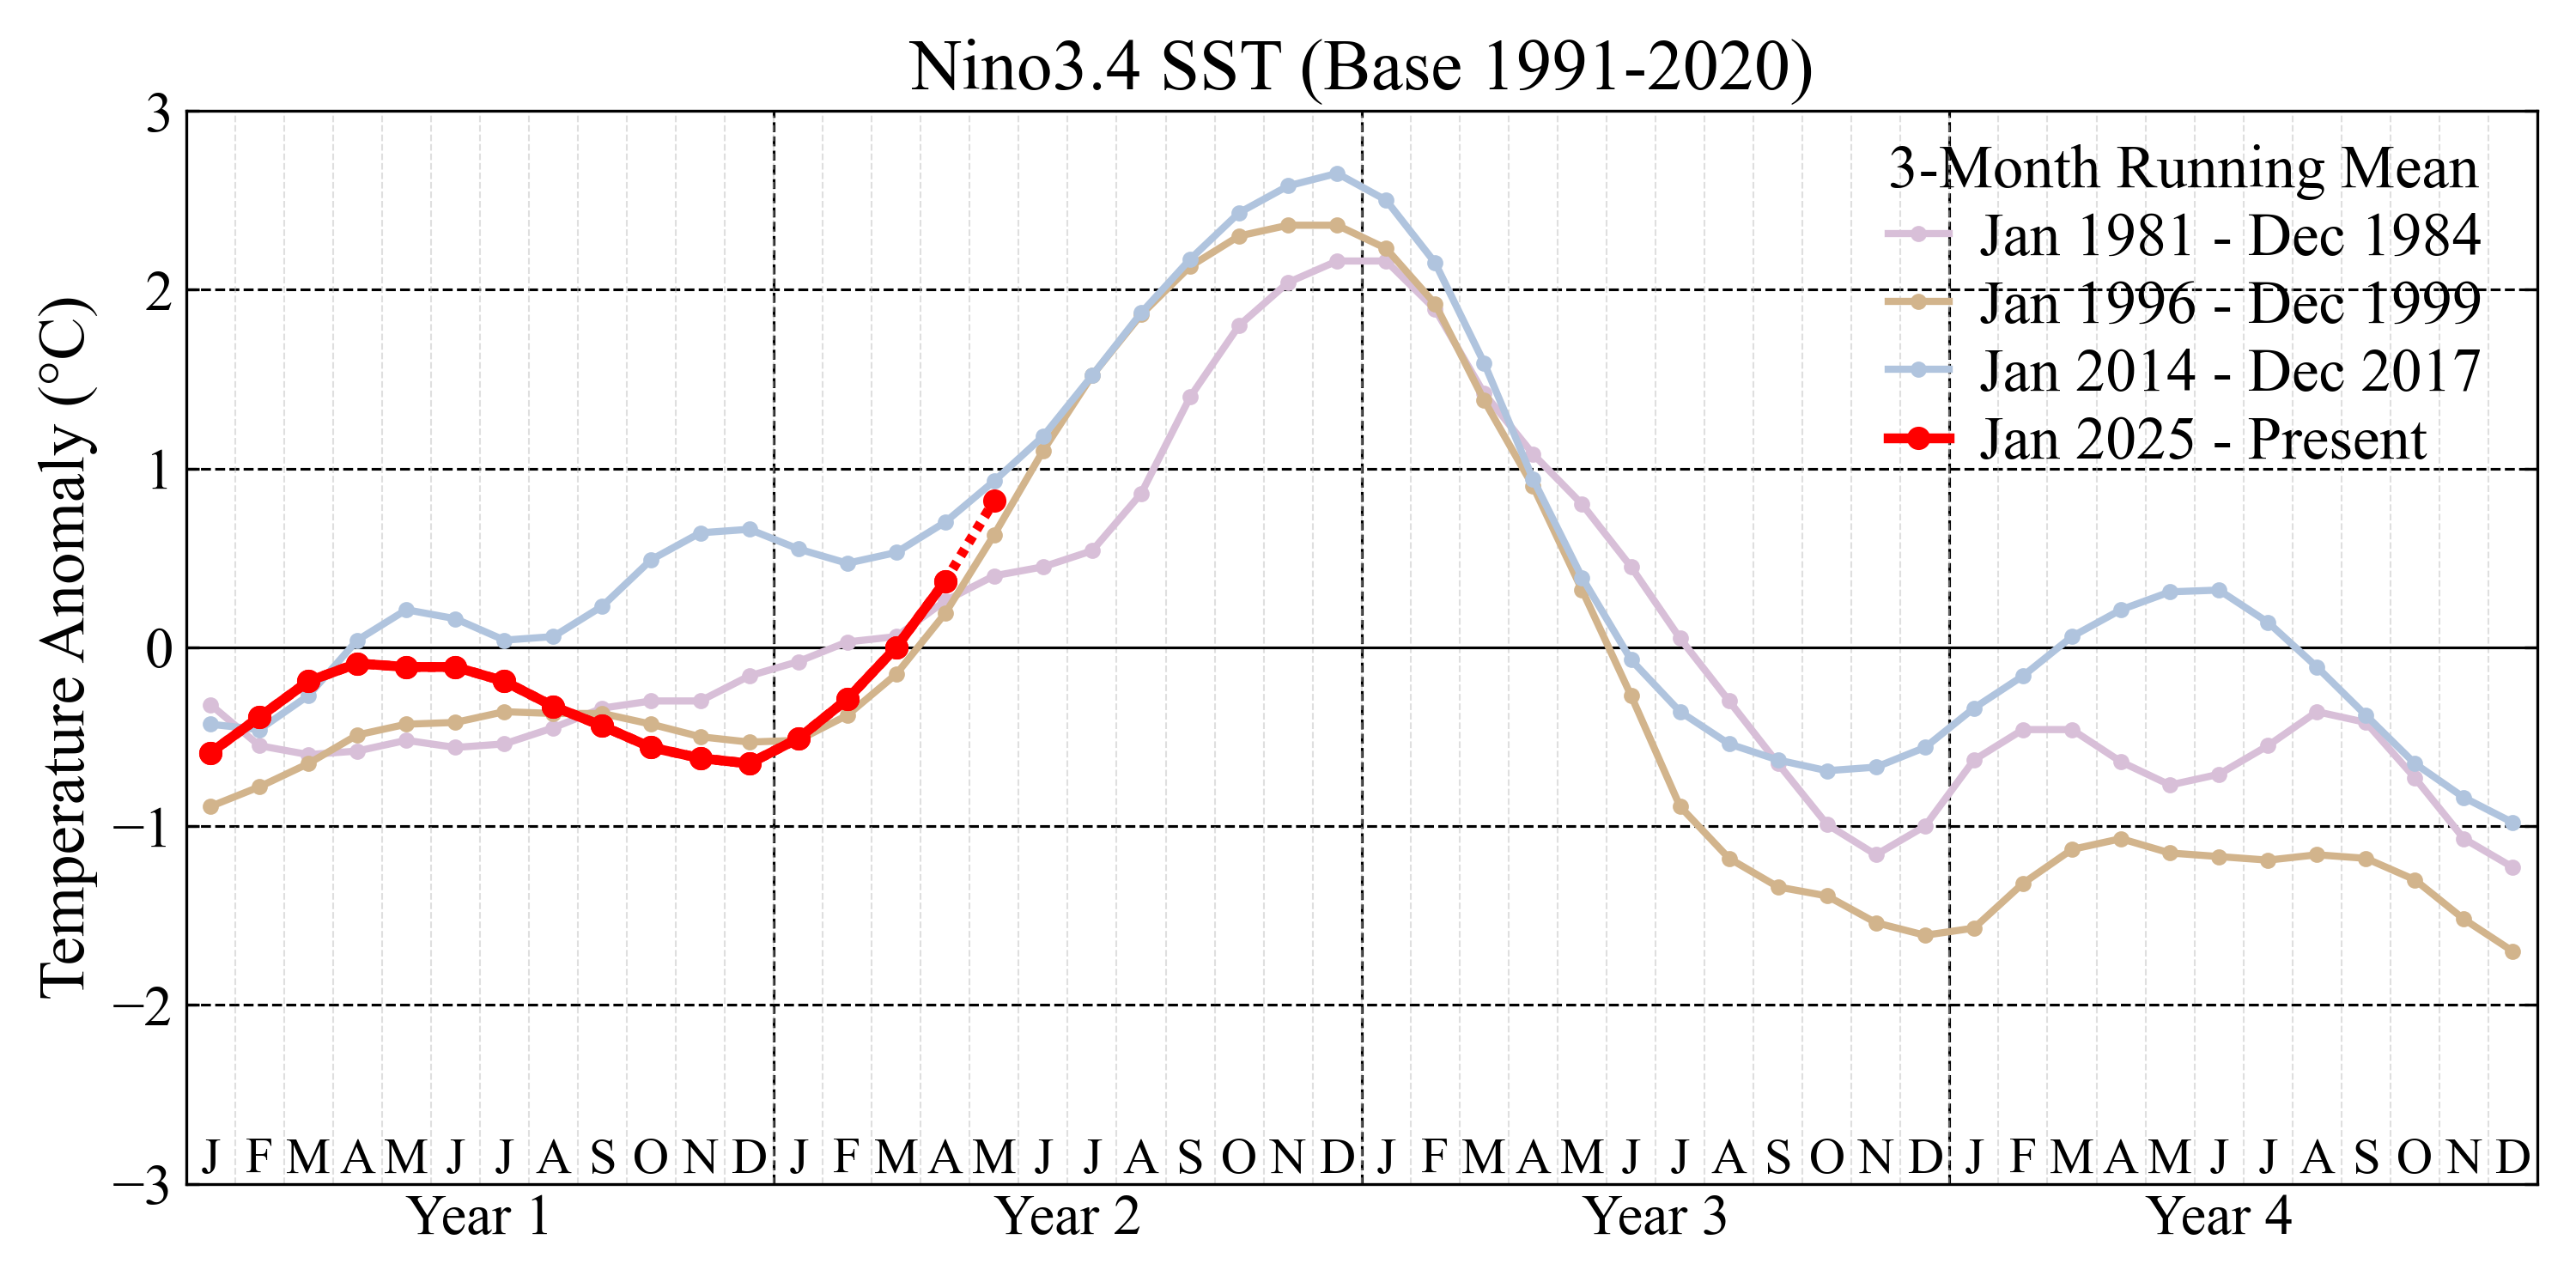
Nino3.4 SST, selected super El Nino periods (base 1991–2020).
Three-month running mean SST anomalies shown for 1981–1984, 1996–1999, 2014–2017,
and 2025–present.
Figure available as
PDF
.
Data through Jun 2026, with the 2025–present curve extended as described above.
Data source:
ref. [1b].
Nino3.4 SST, selected weaker El Nino periods (base 1991–2020).
Three-month running mean SST anomalies shown for 2008–2011, 2017–2020, 2022–2025,
and 2025–present.
Figure available as
PDF
.
Data through Jun 2026, with the 2025–present curve extended as described above.
Data source:
ref. [1b].
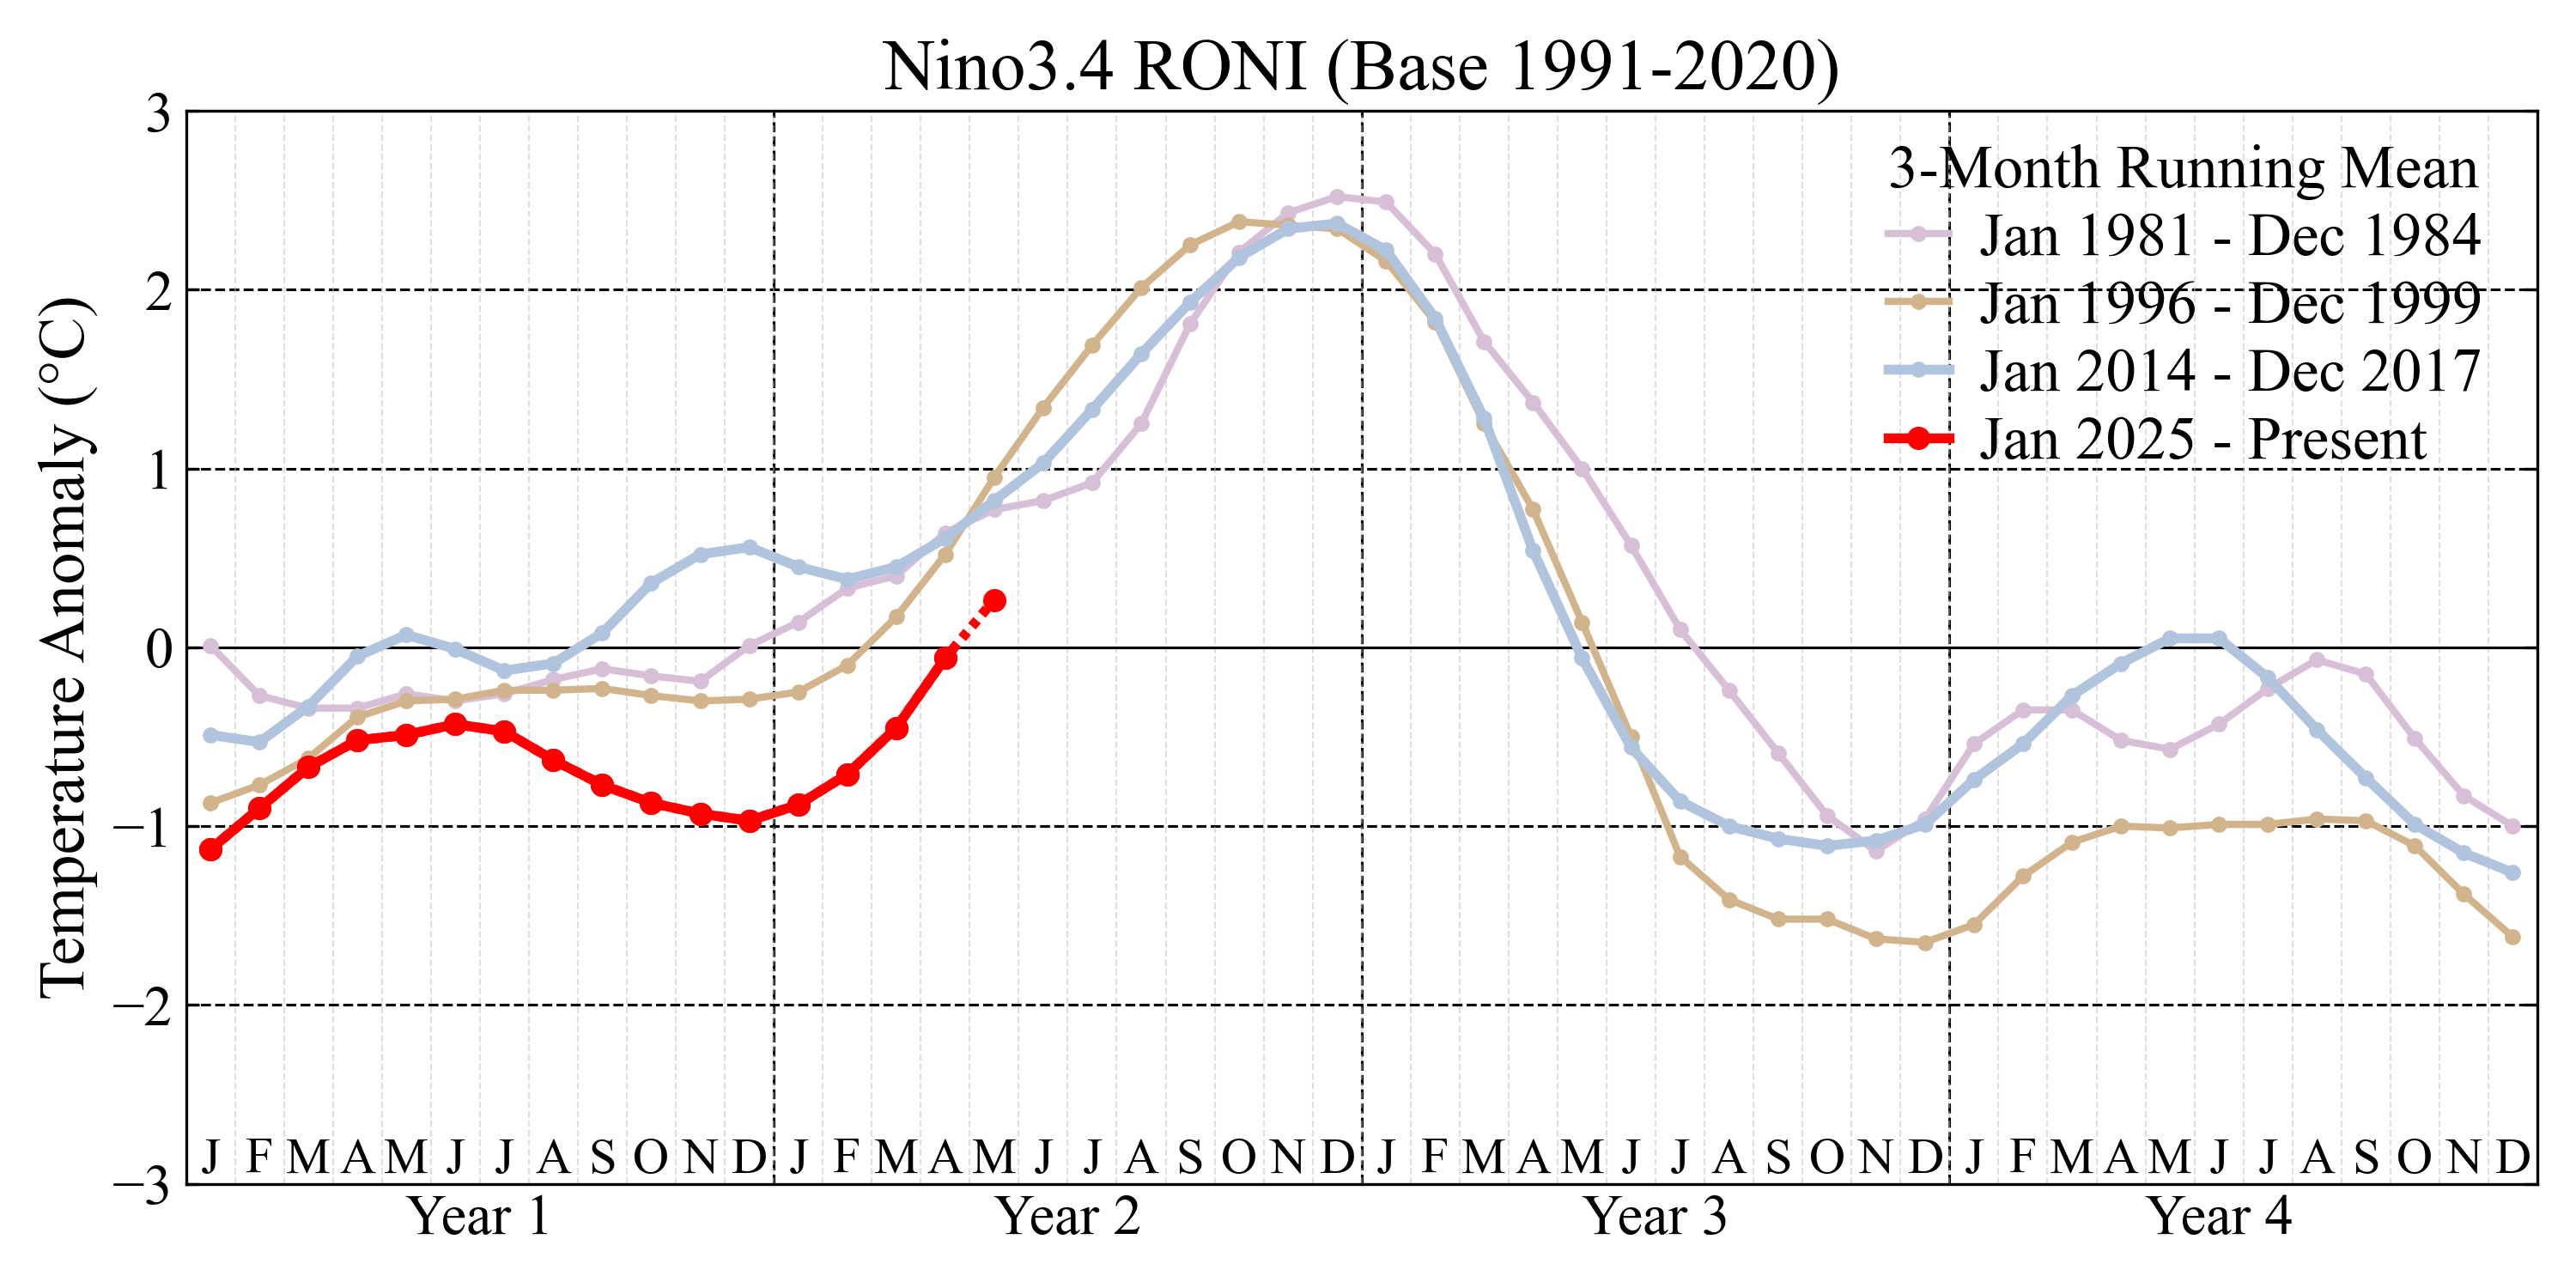
Nino3.4 RONI, selected super El Nino periods (base 1991–2020).
Three-month running mean anomalies shown for 1981–1984, 1996–1999, 2014–2017,
and 2025–present.
Figure available as
PDF
.
Data through Jun 2026, with the 2025–present curve extended as described above.
Data source:
ref. [3].
Nino3.4 RONI, selected weaker El Nino periods (base 1991–2020).
Three-month running mean anomalies shown for 2008–2011, 2017–2020, 2022–2025,
and 2025–present.
Figure available as
PDF
.
Data through Jun 2026, with the 2025–present curve extended as described above.
Data source:
ref. [3].
Equatorial Pacific upper 300 m temperature, selected super El Nino periods (base 1991–2020).
Three-month running mean temperature anomalies for the 180°W–100°W region,
shown for 1981–1984, 1996–1999, 2014–2017, and 2025–present.
Figure available as
PDF
.
Data through Jun 2026, with the 2025–present curve extended as described above.
Data source:
ref. [2].
Equatorial Pacific upper 300 m temperature, selected weaker El Nino periods (base 1991–2020).
Three-month running mean temperature anomalies for the 180°W–100°W region,
shown for 2008–2011, 2017–2020, 2022–2025, and 2025–present.
Figure available as
PDF
.
Data through Jun 2026, with the 2025–present curve extended as described above.
Data source:
ref. [2].
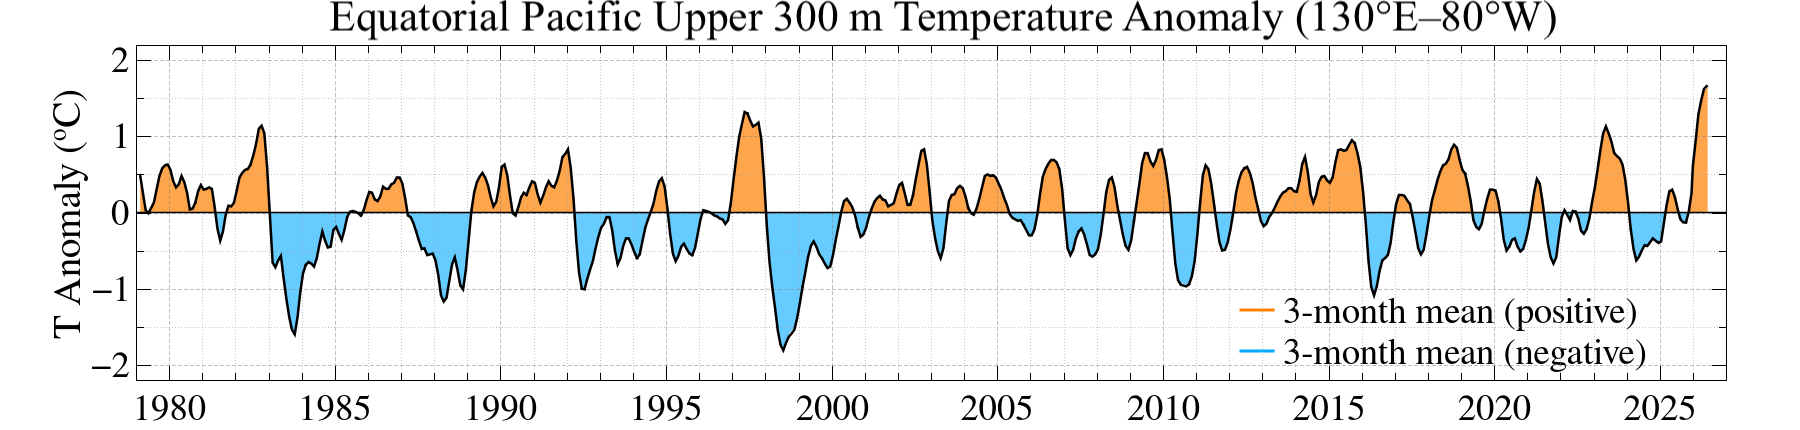
Equatorial Pacific Upper 300 m Diagnostics
Equatorial Pacific upper 300 m temperature (130°E–80°W/280°E, 0.16°N–0.16°S, Jan 1979 – Jun 2026).
3-month running mean temperature anomalies relative to the 1991–2020 base period.
Figure available as
PDF
.
Data through Jun 2026. Data source:
ref. [6].
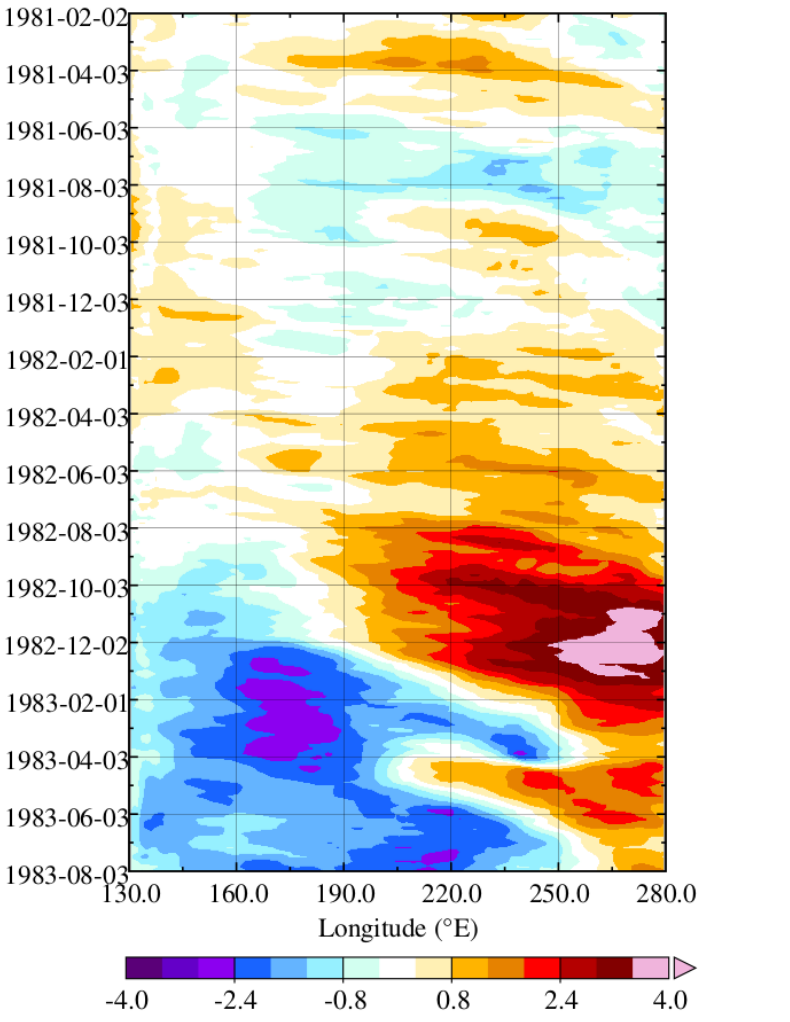
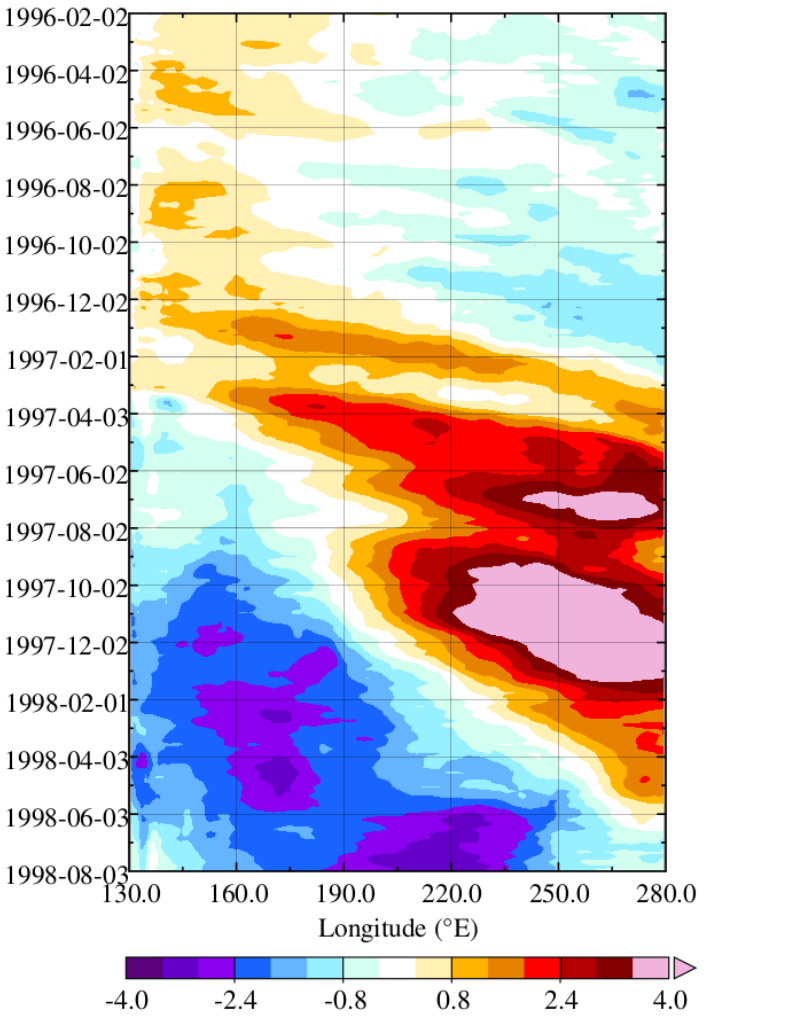
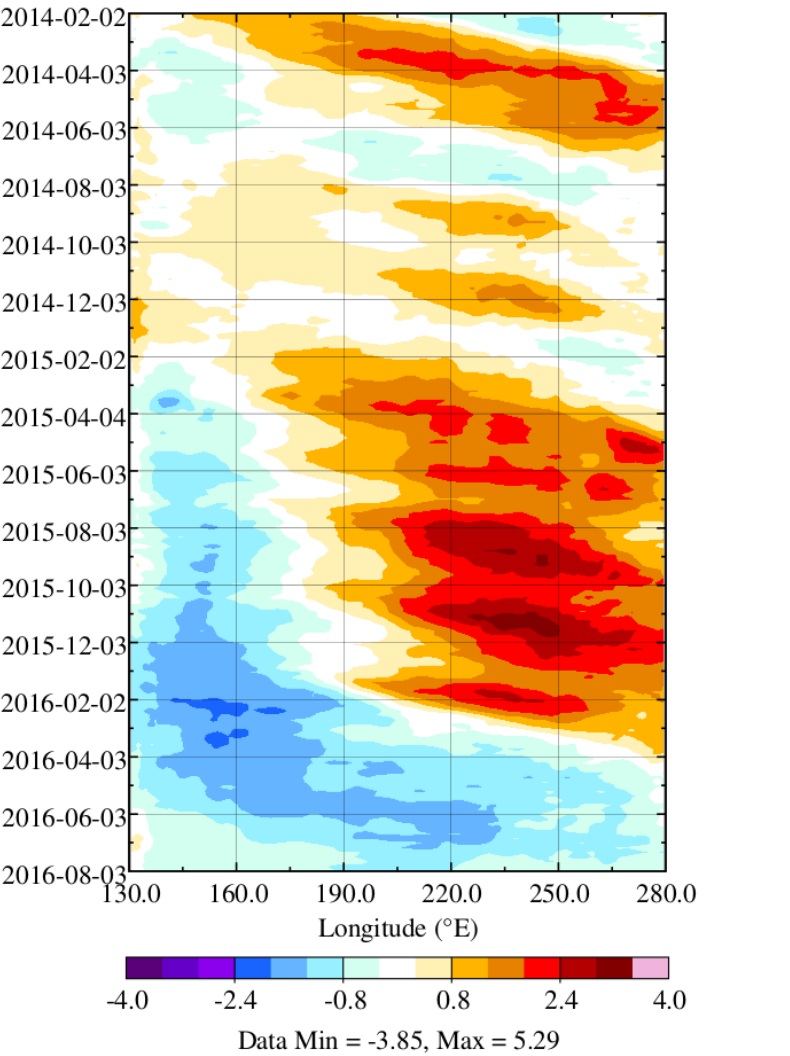
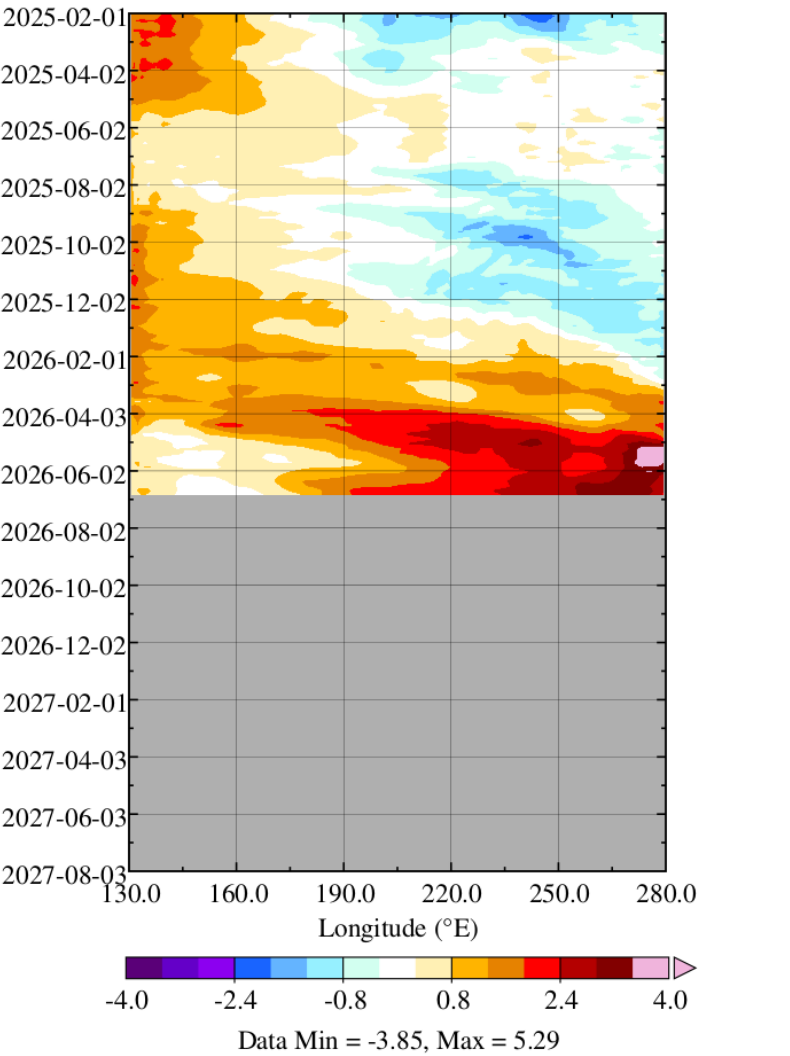
Equatorial Pacific Upper 300 m Temperature Anomaly
(Meridional Mean Over 0.16ºN–0.16ºS, Base 1991–2020)
Equatorial Pacific upper 300 m temperature during four super El Nino events.
Time–longitude plots show meridional means of pentadal (5-day) equatorial Pacific upper 300 m
ocean temperature anomalies relative to the 1991–2020 base period, highlighting Kelvin/thermal
waves during three prior super El Nino events and the current 2026–27 event.
Data source:
ref. [6].
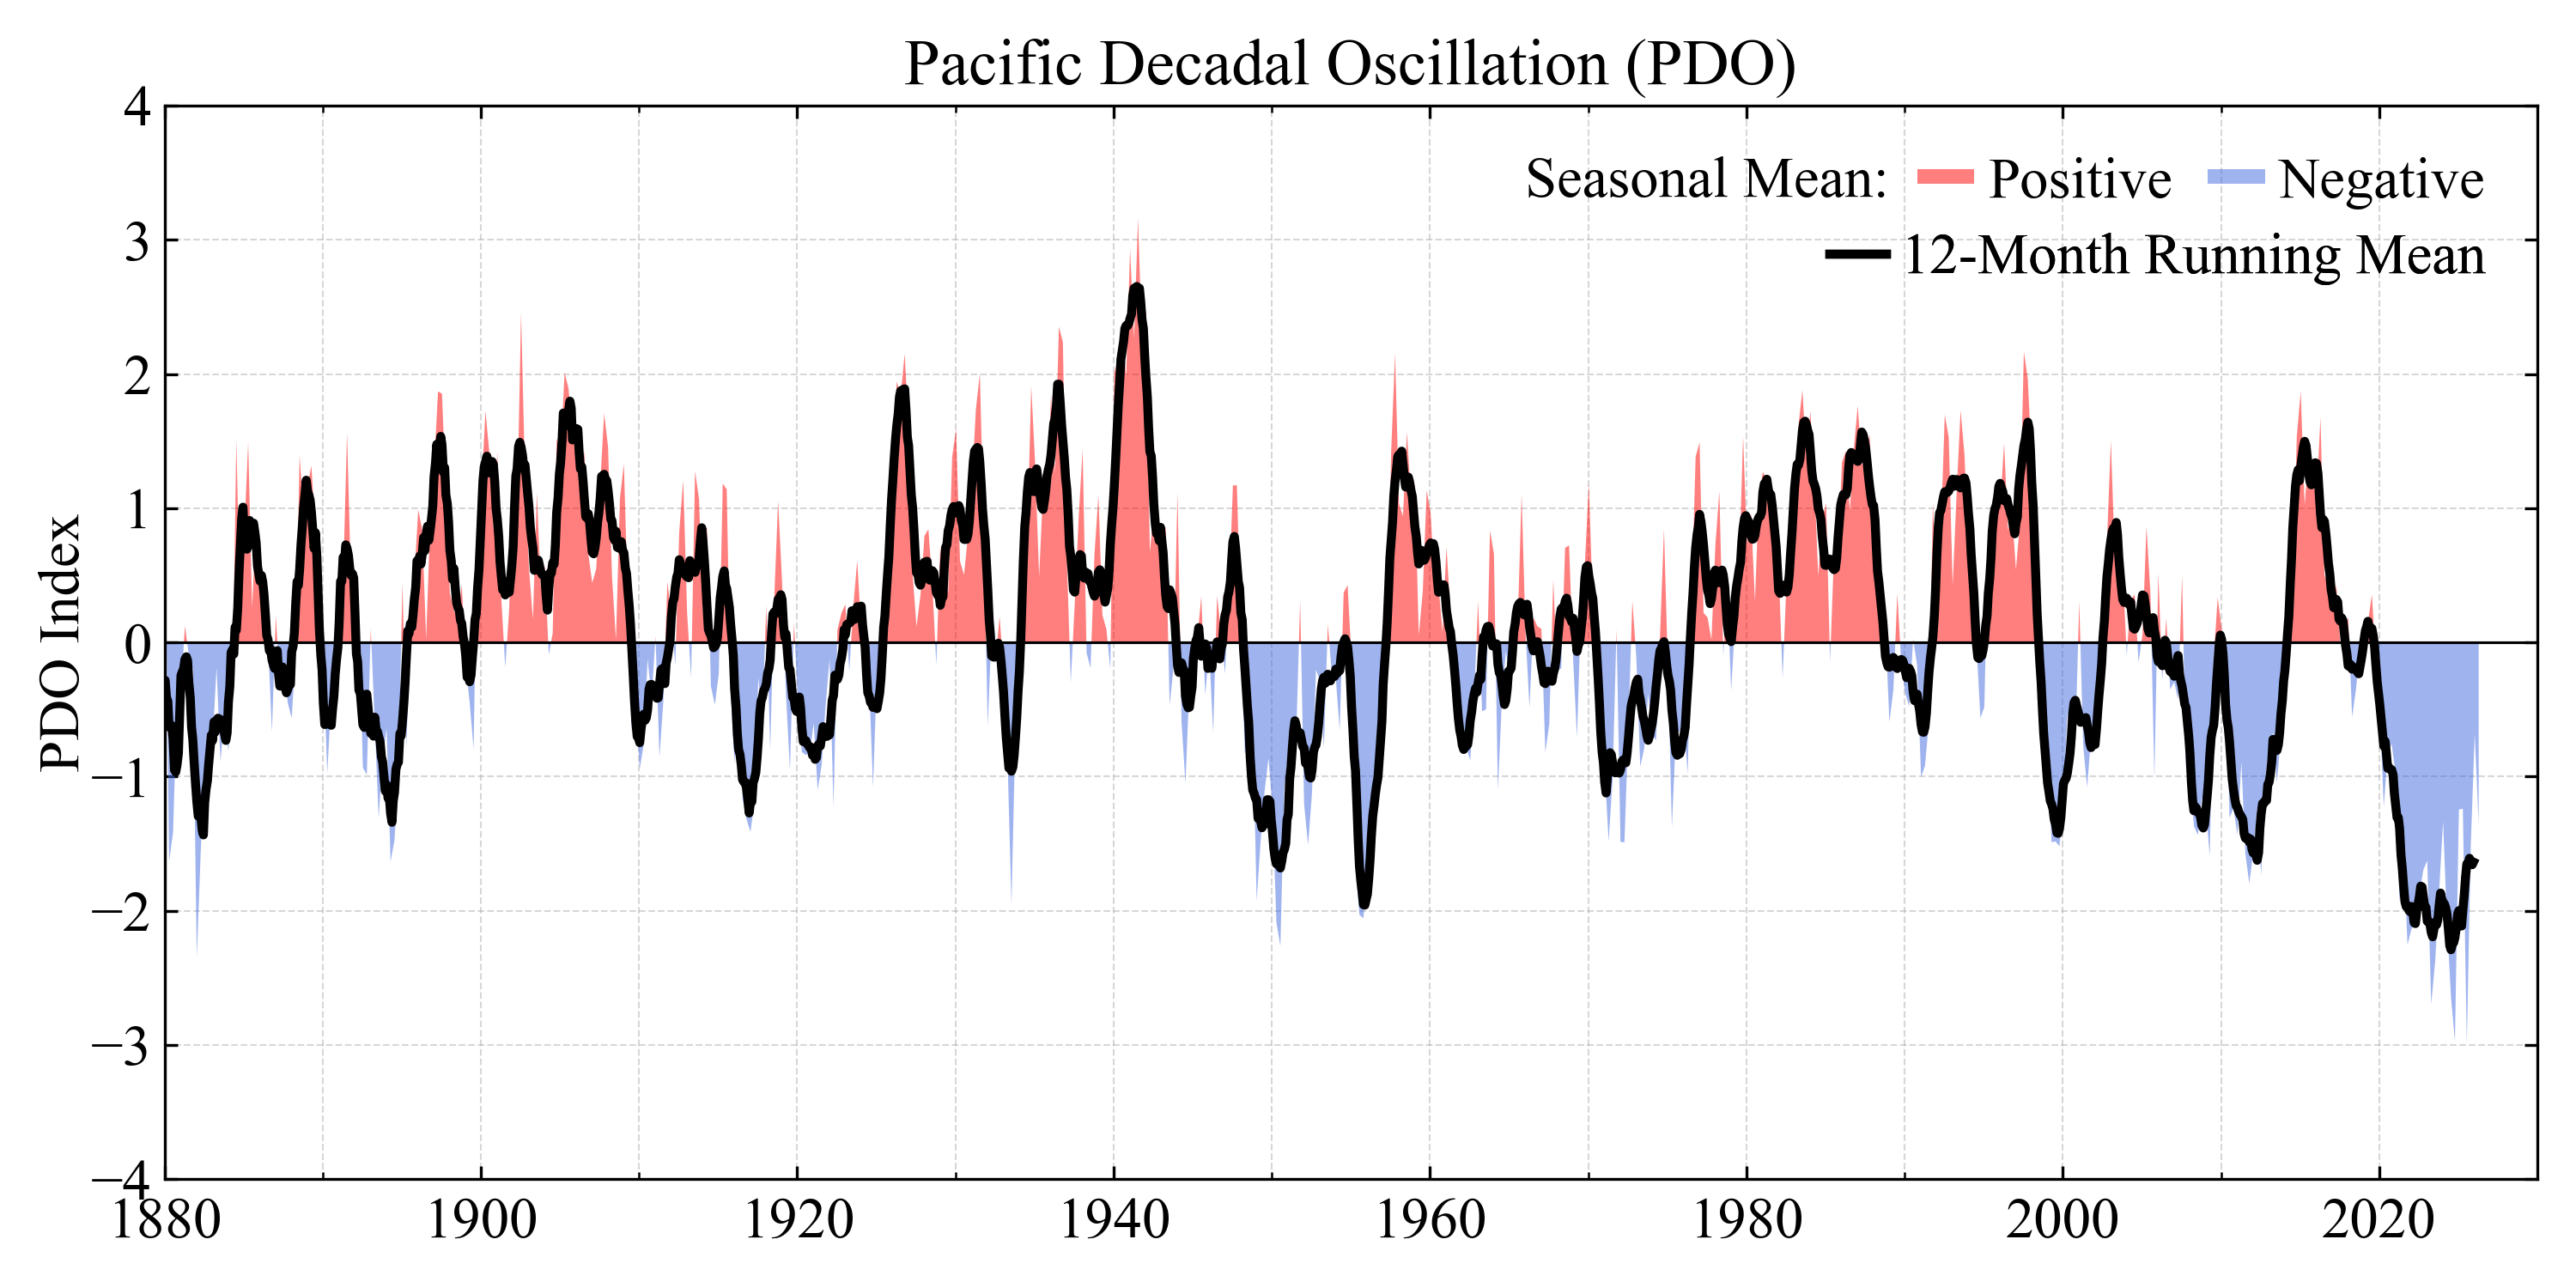
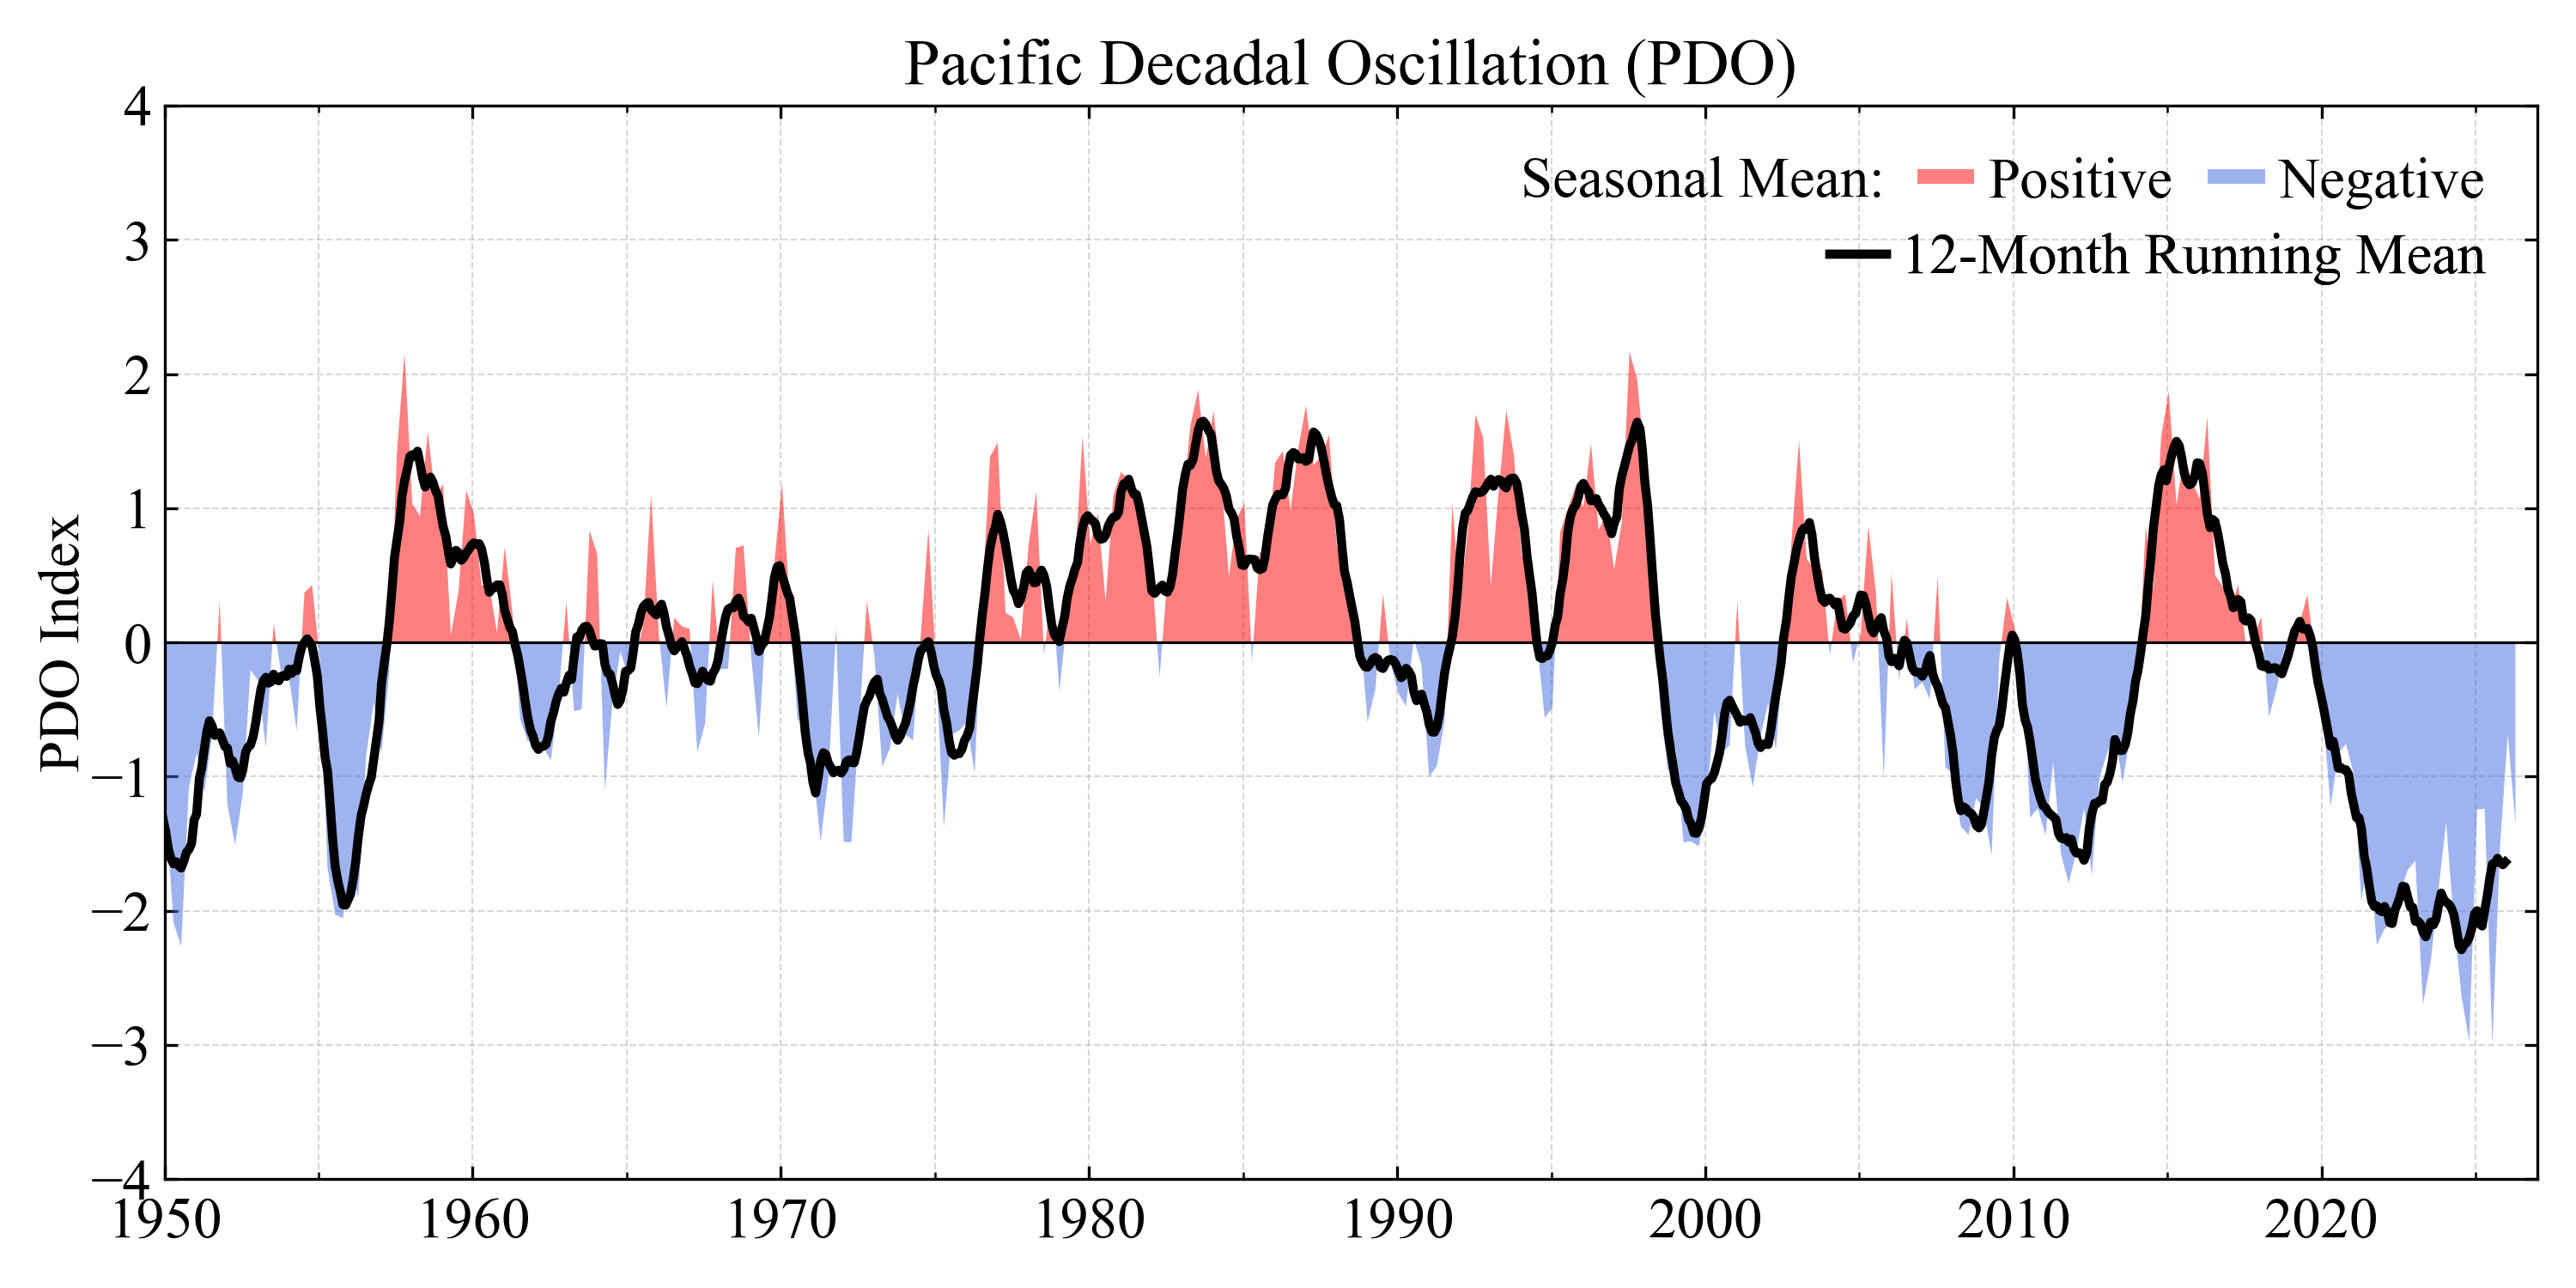
Pacific Decadal Oscillation (PDO)
Note: Running-mean curves necessarily end earlier than the final monthly datum.
PDO index (Jan 1880 – Jun 2026).
Monthly PDO index with seasonal means and 12-month running mean.
Figure available as
PDF
.
Data through Jun 2026. Data source:
ref. [5].
PDO index (Jan 1950 – May 2026).
Monthly PDO index with seasonal means and 12-month running mean.
Figure available as
PDF
.
Data through Jun 2026. Data source:
ref. [5].
-
NOAA Climate Prediction Center (CPC) indices
.
(a) Data table (Nino 3.4; Unadjusted weekly OISSTv2.1; 1991–2020 base):
wksst9120.for
.
(b) Data table (Nino 3.4; Monthly ERSSTv5; 1991–2020 base):
ersst5.nino.mth.91-20.ascii
.
-
NOAA PSL Central Pacific heat content (upper 300 m temperature anomaly)
.
Data table (CPC equatorial upper-300 m temperature anomaly index; 180°W–100°W):
heat_content_index.txt
.
-
NOAA CPC Relative Oceanic Nino Index (RONI)
.
Data table:
RONI.ascii.txt
.
-
NASA GISS Surface Temperature Analysis (GISTEMP v4)
.
-
NOAA NCEI Pacific Decadal Oscillation (PDO) Index
.
PDO plots use NOAA ERSSTv6 sea surface temperature data.
ERSSTv6 description:
NOAA PSL ERSSTv6
.
-
NOAA Climate Prediction Center Global Ocean Data Assimilation System (GODAS) pentadal data
.
Equatorial Pacific upper-ocean temperature fields are provided at 5-day resolution.