Global Temperature — More Figures
Additional global temperature figures, analyses, and archive material related to the NASA GISS temperature record. The featured section below includes interactive annual mean surface temperature anomaly maps for 1990–2025, along with selected supplementary figures. The legacy archive below contains annual map panels, summary figures, regional and seasonal analyses, and other supplementary material.
<> <> <> <> <> <> <> <>
Contents
Featured Content
Interactive annual mean maps (1990–2025)
Additional ENSO and global temperature relationships
Legacy and Archive Figures
Annual Analysis Archive
Summary Figures (November 2024)
Monthly Analysis (December 2024)
Changes in Seasonal Resolution (2024)
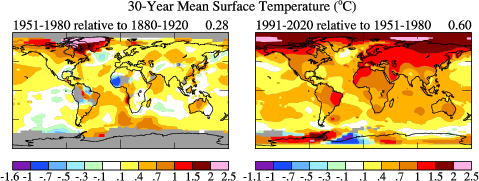
Decadal Anomalies (January 2024)
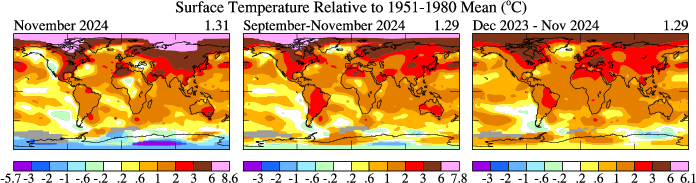
Regional Changes (November 2024)
Archive — 1880–1920 base period global graph (June 2024)
Recent Overview Panels (June 2024)
Updates of figures in Hansen, et al. 2006, PNAS
Base Periods
El Nino & La Nina — Archive Figures (November 2024)
<> <> <> <> <> <> <> <>
Featured ContentInteractive annual (Jan-Dec) mean surface temperature anomaly maps, 1990–2025
Speed: slower ← → faster
Notable years: 1992 Pinatubo cooling | 1998 El Nino | 2010 acceleration onset | 2016 El Nino | 2021 La Nina contrast | 2023 record warmth | 2024 record warmth | 2025 latest map
Loading annual temperature data...
Selected map available as PDF.
Last updated: 12 June 2026.
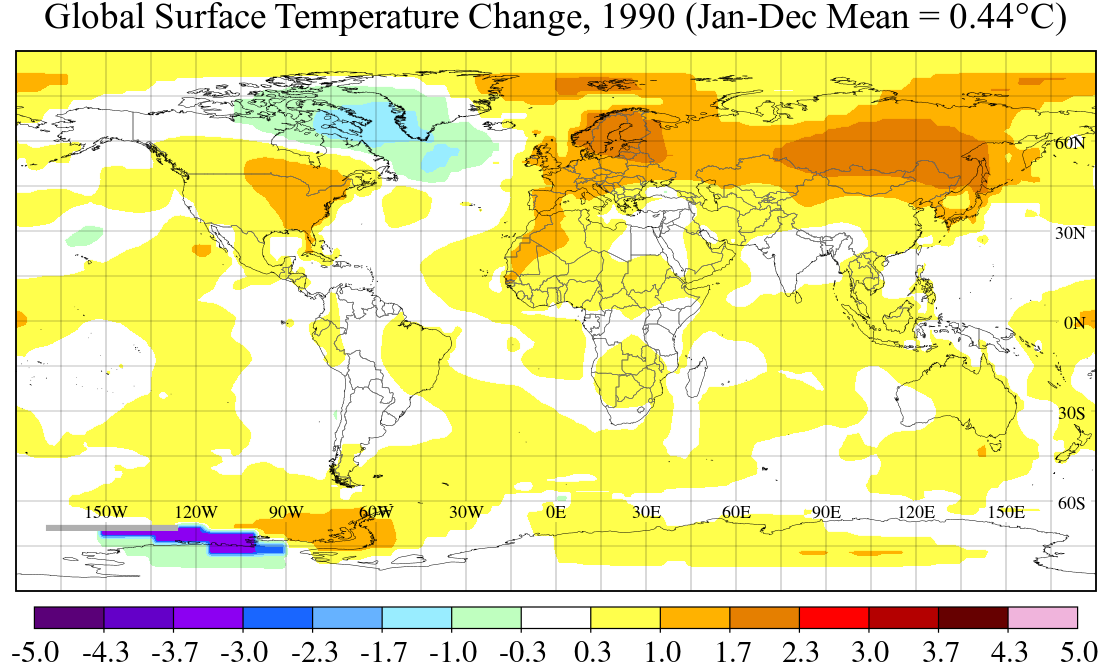
Annual mean surface temperature anomaly maps relative to the 1951–1980 base period, 1990–2025. Use the menu above to select a year. These maps show the spatial pattern of global warming and allow comparison of individual years, including major El Nino events and the effects of volcanic eruptions.
<> <> <> <> <> <> <>
ENSO and Global Temperature RelationshipsAdditional comparison figures showing detrended 12-month running means of global surface temperature, Nino3.4, and equatorial Pacific upper-300 m temperature for selected periods. Additional versions are available on the main El Nino & La Nina page.
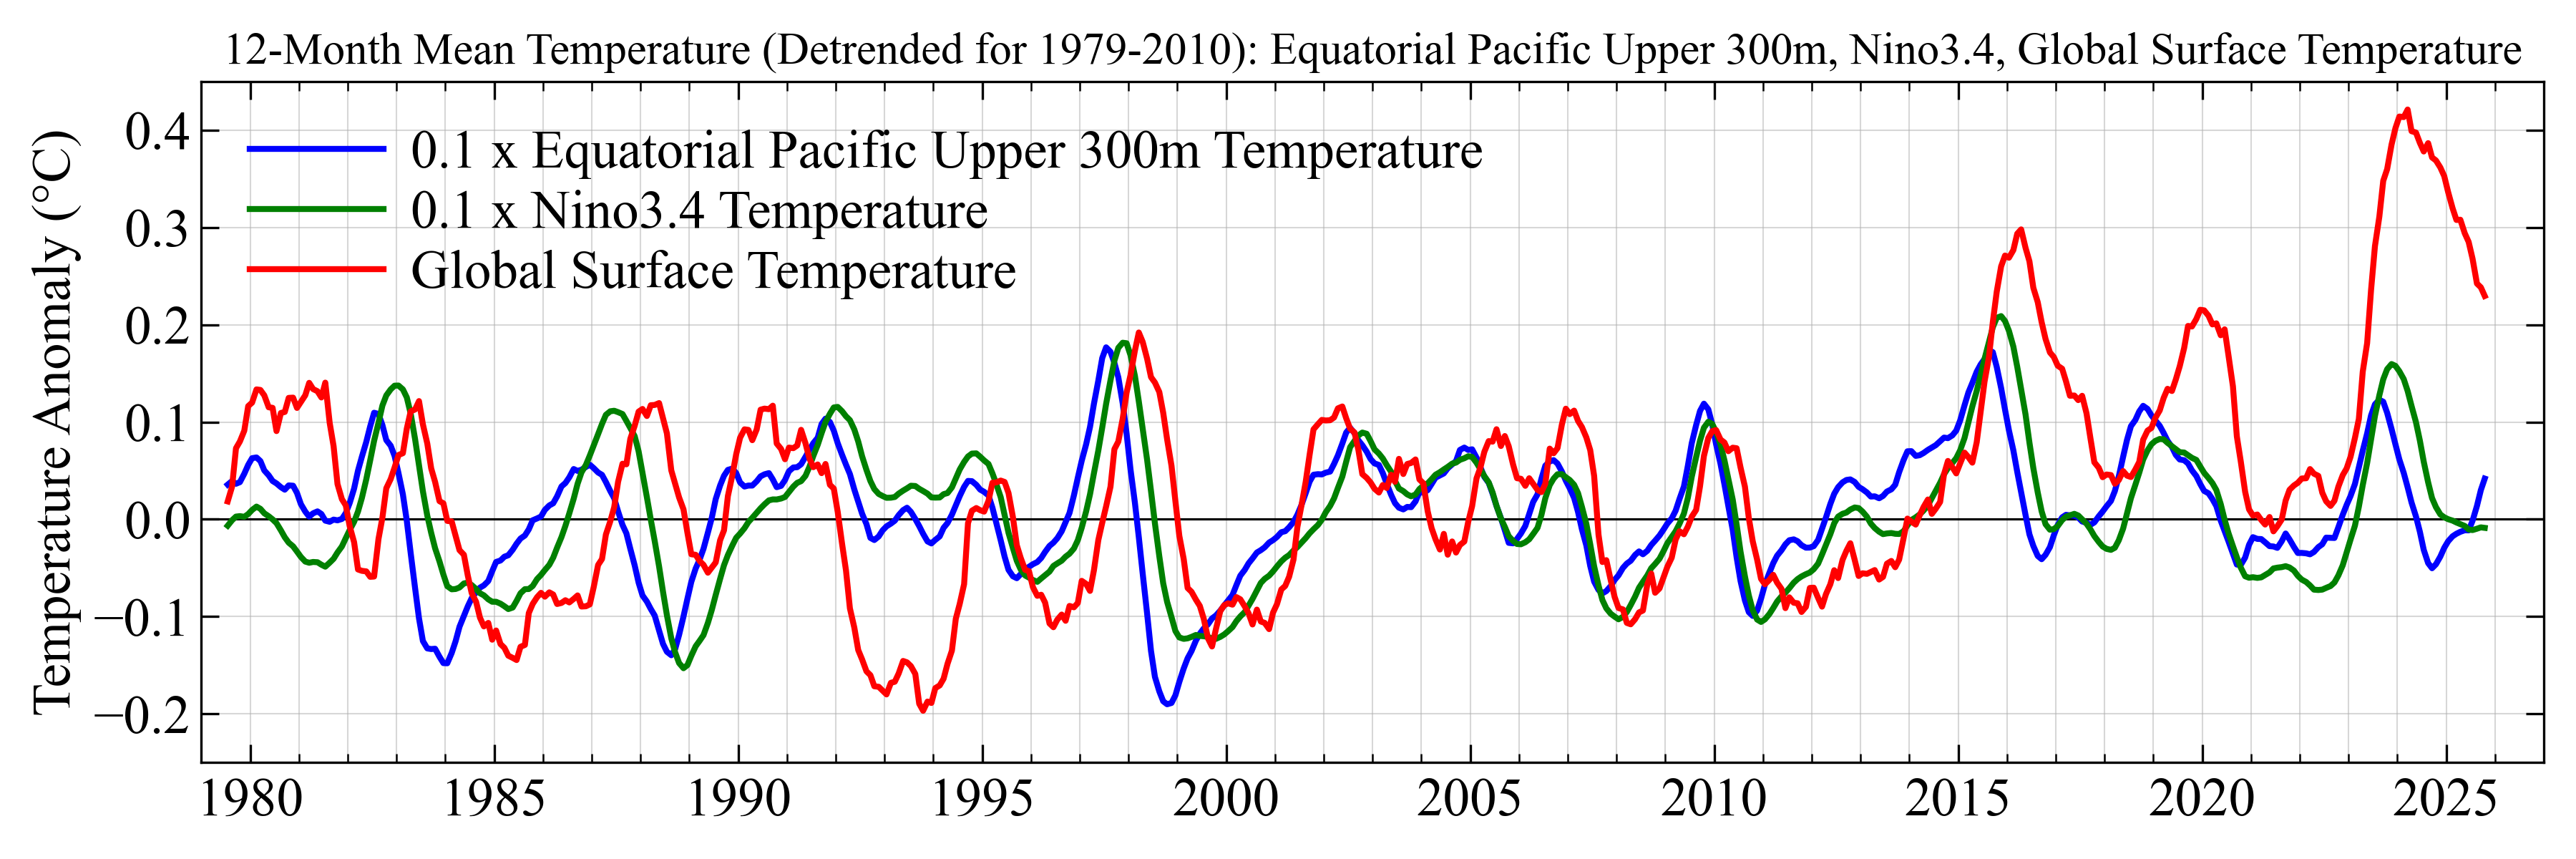
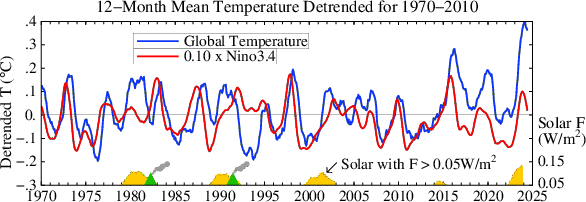
Global temperature, Nino3.4, and equatorial Pacific upper 300 m temperature. Detrended 12-month running means for 1979–2010, with Nino3.4 and upper-300 m temperature scaled by 0.1.
Last updated: 12 June 2026.
Figure also available in PDF. Data through February 2026. Underlying data sources: ref. [4], ref. [1], ref. [2].
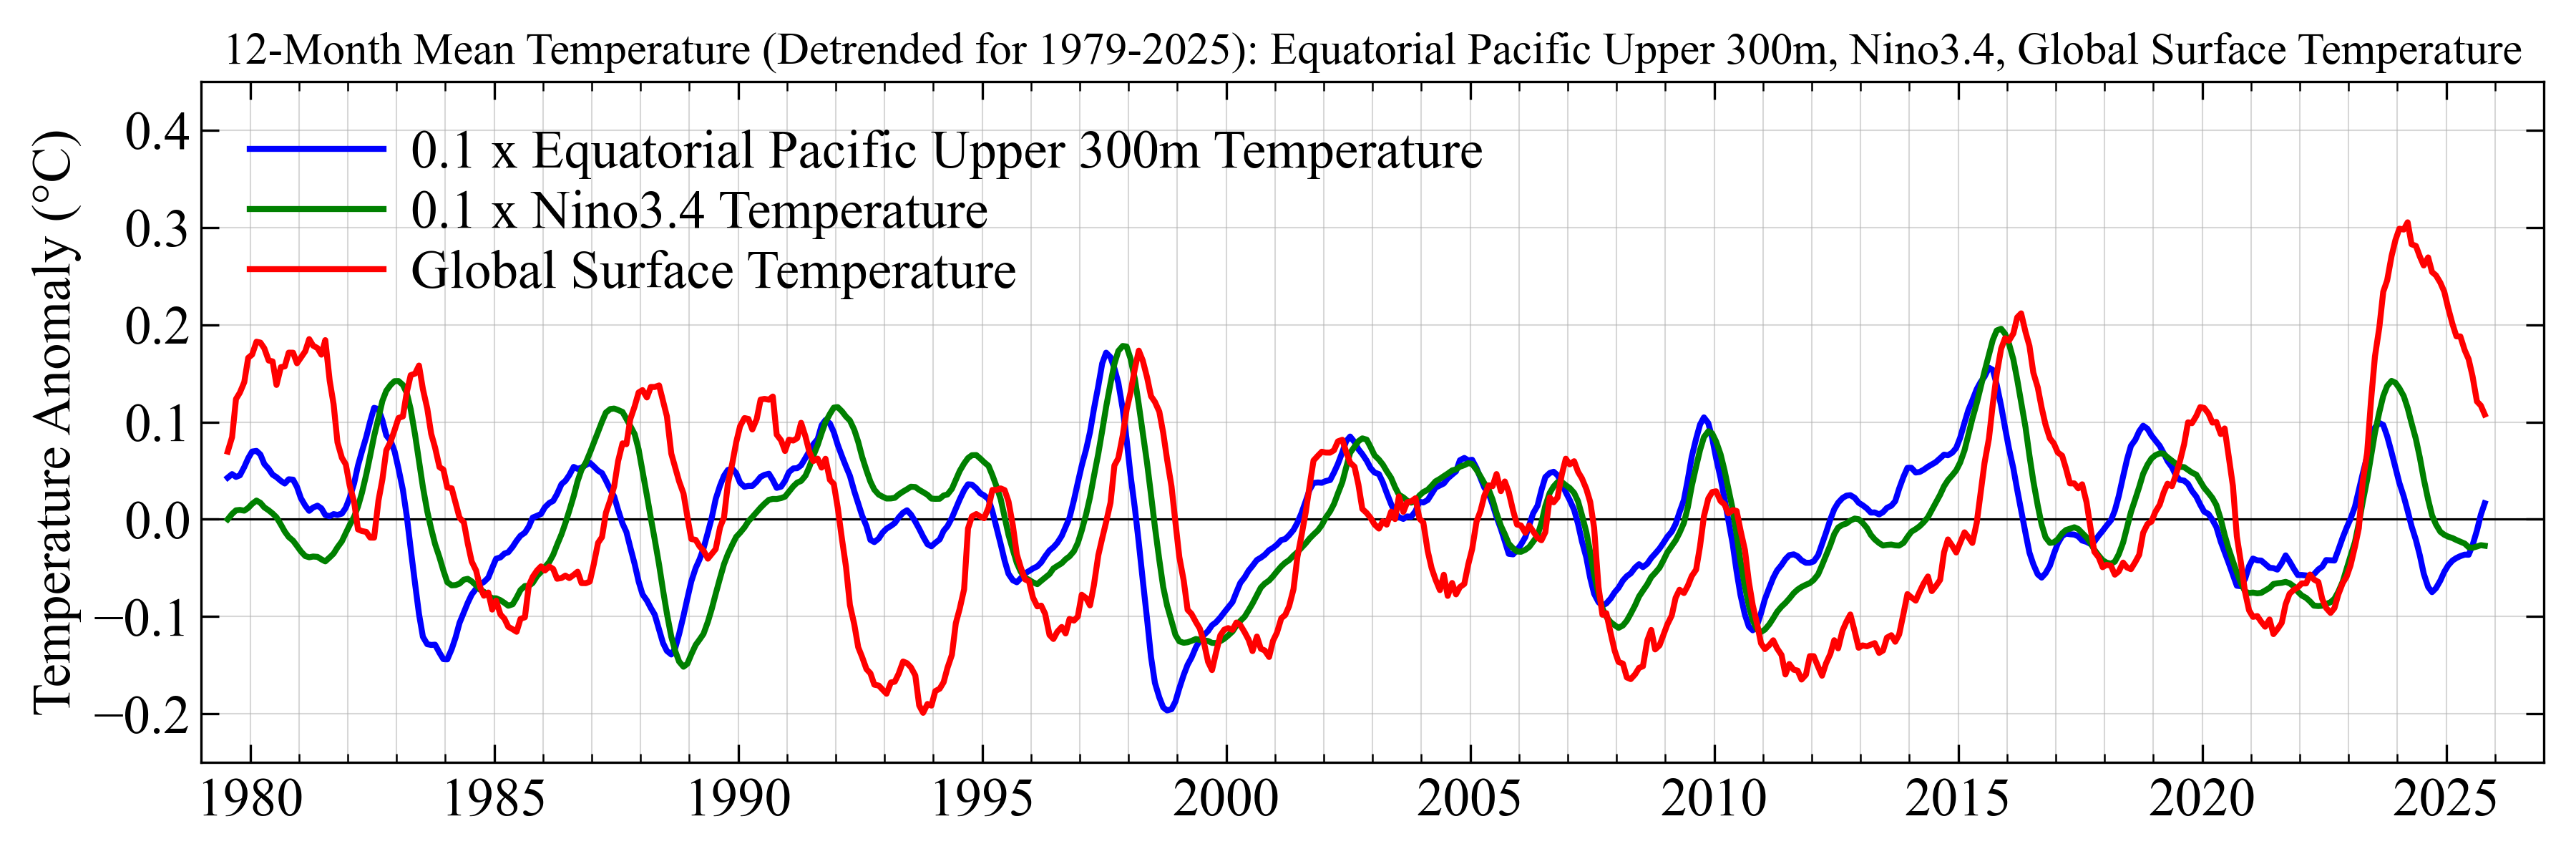
Global temperature, Nino3.4, and equatorial Pacific upper 300 m temperature. Detrended 12-month running means for 1979–2025, with Nino3.4 and upper-300 m temperature scaled by 0.1.
Last updated: 12 June 2026.
Figure also available in PDF. Data through February 2026. Underlying data sources: ref. [4], ref. [1], ref. [2].<> <> <> <> <> <> <> <>
Legacy and Archive Figures<> <> <> <> <> <> <>
Annual Analysis Archive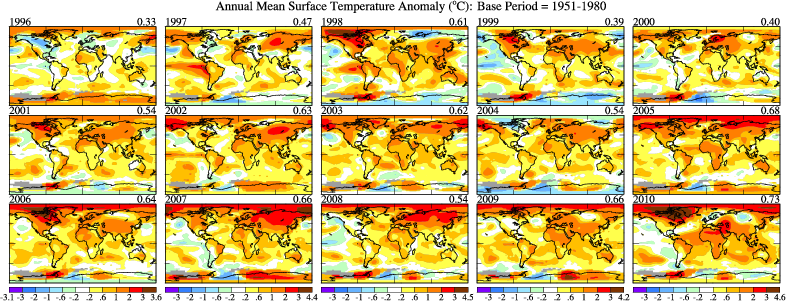
(Updated on 2019/07/16)
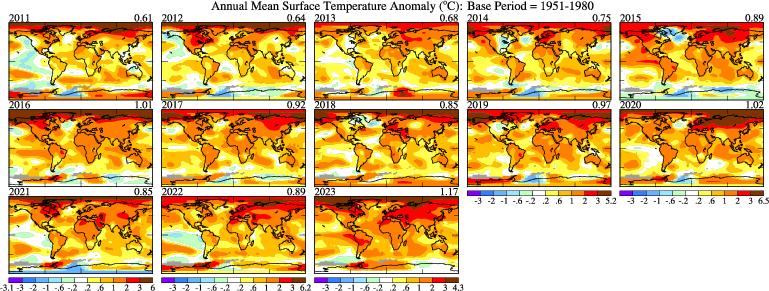
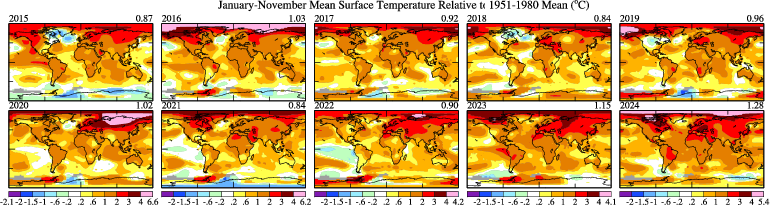
Annual mean surface temperature anomaly since 1996. Since 1880 (140 years) the top 5 warmest years fall in 2015-2022 and top 10 warmest years fall in 2010-2022. Now with GHCN v4 and ERSST v5. (Updated on 2023/12/14)
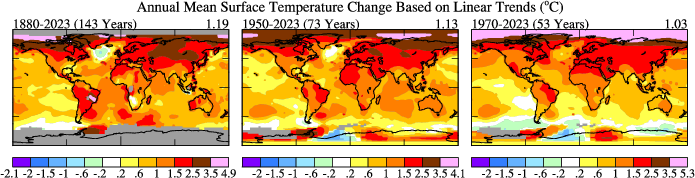
Annual mean surface temperature changes based on linear trends. Figure also available in PDF. (Updated on 2024/01/12 with GHCN v4 and ERSST v5)
<> <> <> <> <> <> <> <>
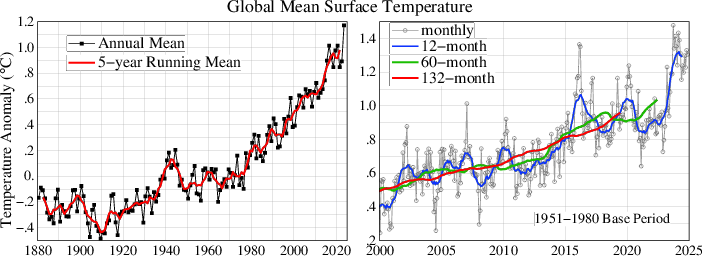
Summary Figures
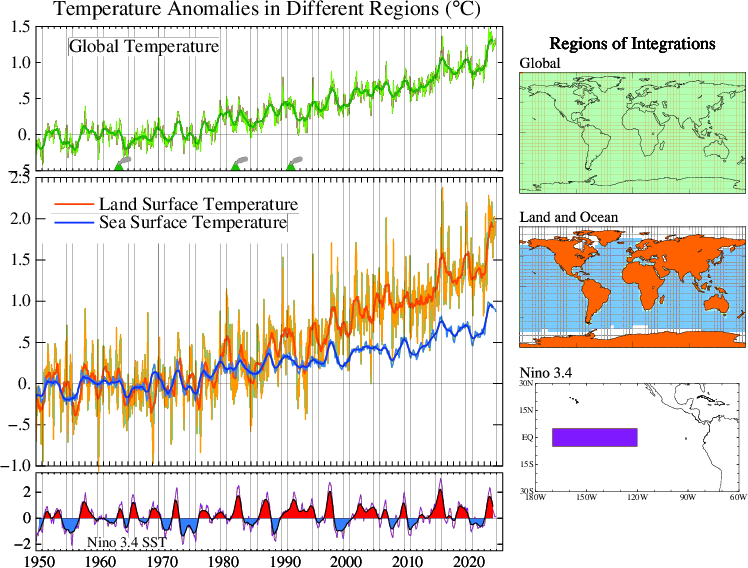
Monthly (thin lines) and 12-month running mean (thick lines or filled colors in case of Nino 3.4 Index) global land-ocean temperature anomaly, global land and sea surface temperature, and El Nino index. All have a base period 1951-1980. Figure also available in PDF. The monthly mean temperature anomaly data are available over land (data) and over ocean (data). (Data through November 2024. last updated 2024/12/10, now with GHCN v4 and ERSST v5.)
For Nino 3.4 SST see El Nino/La Nina page (last modified 2026/13/04) for data source and more information.
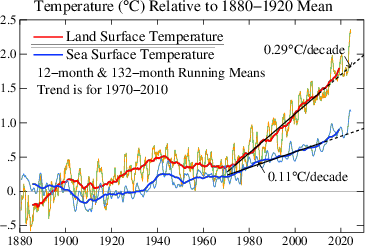
Land and ocean surface temperature with 1880-1920 base period in PDF. (2024/12/10)
<> <> <> <> <> <> <>
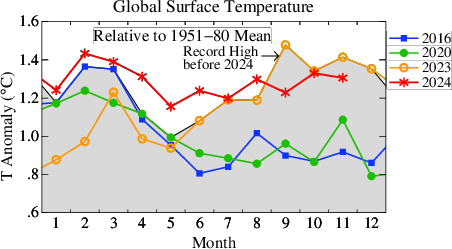
Monthly Analysis
Comparison of temperature of the last ten years. (Updated on 2024/12/10, now with GHCN v4 and ERSST v5)
- - - - - - -
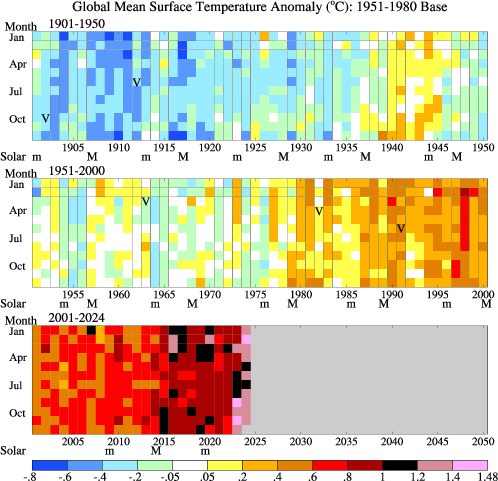
Global-mean monthly-mean surface temperature anomalies with the base period 1951-1980. V denotes the major volcanic eruptions, and m and M denote the years of the minima and maxima of sunspot number cycles, respectively. (Updated on 2024/12/10, now with GHCN v4 and ERSST v5.)
<> <> <> <> <> <> <>
Changes in Seasonal Resolution
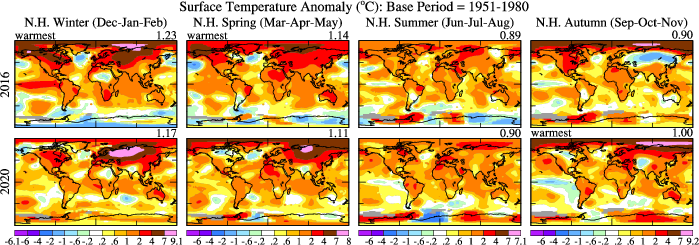
Seasonal mean surface temperature anomaly for 2016 and 2020. (Updated on 2021/03/12, now with GHCN v4 and ERSST v5)
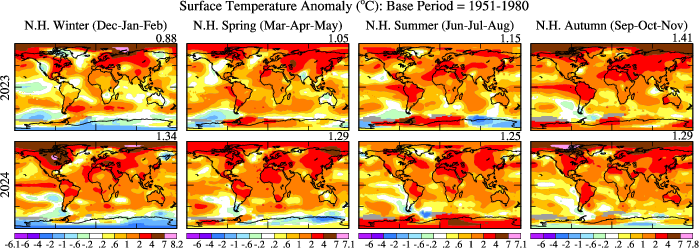
Seasonal mean surface temperature anomaly for 2023 and 2024. (Updated on 2024/12/10, now with GHCN v4 and ERSST v5)
<> <> <> <> <> <> <>
Decadal Anomalies
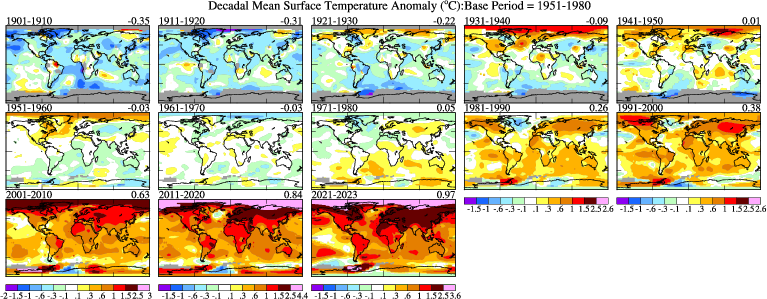
Figure also available in PDF. (Updated on 2024/01/12, with GHCN v4 and ERSST v5)
<> <> <> <> <> <> <>
Regional Changes
Zonal Means
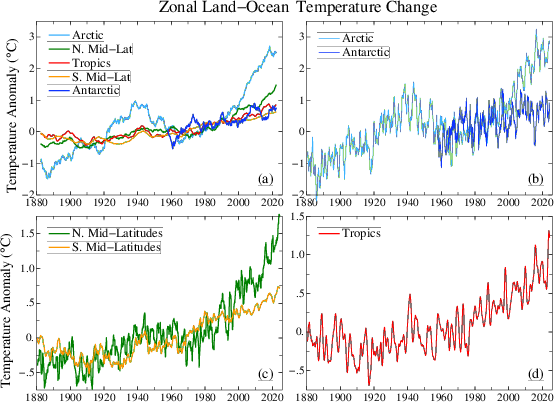
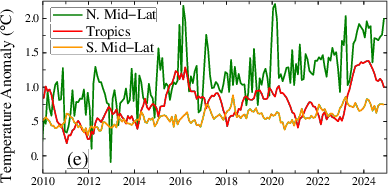
Zonal mean, (a) 60-month, (b-d) 12-month running mean and (e) monthly mean temperature changes in five zones: Arctic (90.0 - 64.2°N),
N. Mid-Latitudes (64.2 - 23.6°N), Tropical (23.6°S),
S. Mid-Latitudes (23.6 - 64.2°S), and Antarctic (64.2 - 90.0°S).
Figures in PDF: (a)-(d) and (e).
(Data through November 2024 used. Updated on 2024/12/10 now with GHCN v4 & ERSST v5)
<> <> <> <> <> <> <>
Archive – 1880–1920 base period global graph
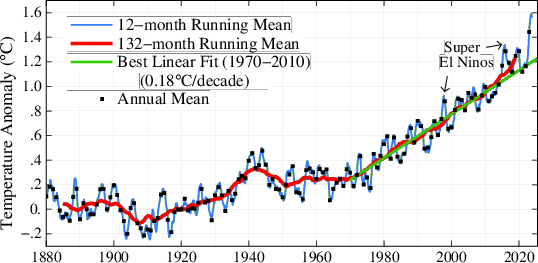
1880–1920 base period PDF
With Predictions (Updated 2024/06/11) and With Current Trend (Updated 2024/06/26).
<> <> <> <> <> <> <>
Recent Overview Panels (June 2024)
<> <> <> <> <> <> <>
Updates of figures in Hansen, et al. Global temperature change, 2006, PNAS.
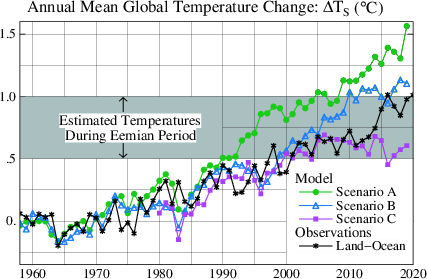
Extended to 2030 (Updated 2024/12/11) and Extended to 2062. Data from Dr. Gavin Schmidt (Updated 2021/01/22)
.
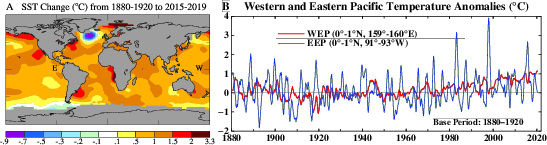
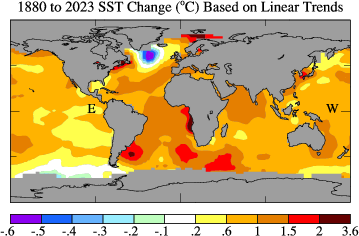
Figure 9 in PDF. Data provided by Dr. Reto Ruedy of NASA/GISS. (Updated 2020/11/30)
.
<> <> <> <> <> <> <>
<> <> <> <> <> <> <>
El Nino & La Nina – Archive FiguresThe figures below are legacy or supplementary ENSO diagnostics retained for reference. Updated ENSO plots are available on the main El Nino & La Nina page .
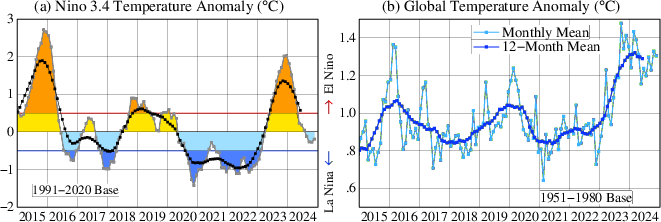
Nino 3.4 SST (legacy stacked panel)
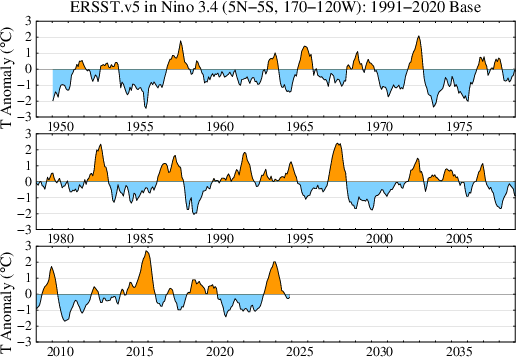
PDF, data through November 2024. Data source: NOAA Climate Prediction Center , last modified: 2024/12/03.
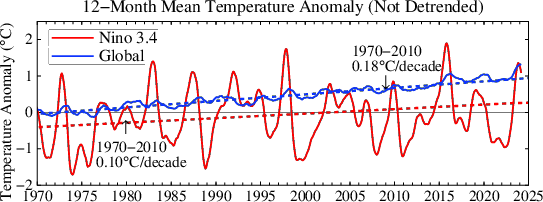
Global vs Nino 3.4 (12-month mean, no detrending)
Detrended global vs Nino 3.4 (12-month mean)
Global mean temperature minus 0.104 × Nino 3.4 SST
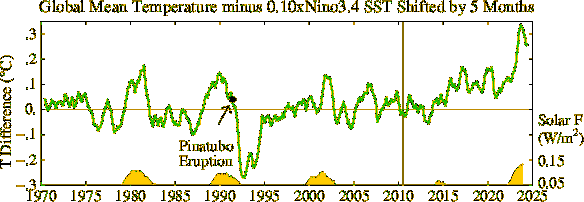
PDF – data through November 2024 used, last modified: 2024/12/19.
Historical GISS/ERSST comparison
Temperature anomaly in GISS analysis. The base periods are shifted. (last modified: 2013/05/06)
Equatorial upper-ocean (0–300 m, 180–100°W) temperature
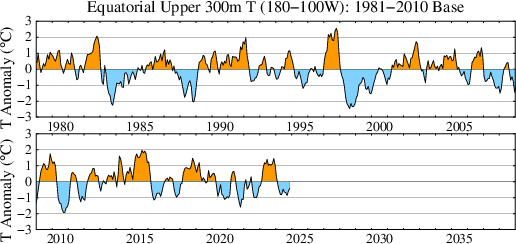
PDF, data through November 2024. Data source: NOAA Climate Prediction Center , last modified: 2024/12/01.
Nino 3.4 SST and equatorial upper-ocean temperature
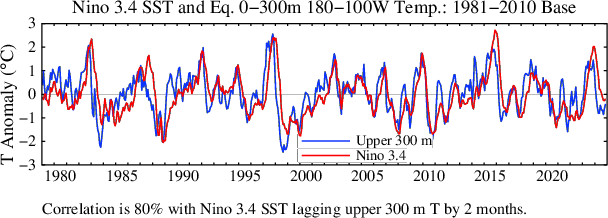
Data through November 2024, last modified: 2024/12/04.
<> <> <> <> <> <> <>
All above data source: NASA Goddard Institute for Space Studies, New York, NY,
except several NOAA data sets mentioned above.
(See
data.giss.nasa.gov/gistemp for details and data.)
Note: The Byrd Station data in central West Antarctica were replaced by Bromwich et al's data. (since 2013/03/21)