Methods

Data for this project will be gathered and analyzed using social science and remote sensing methods combined with climate data, and then will be used to construct a mixed-effects model. This model will be used to produce simulations according to scenarios of change in key social, policy, and climate variables (see figure below for an overview and relationship among methods.)

In order to test our hypotheses on the interactive effects of different land uses, settlement patterns, and climate on escaped fire frequency and extent, we will select eight 2,500 ha study sites that represent combinations of all independent variables (see Location for further details) .


Social and physical data

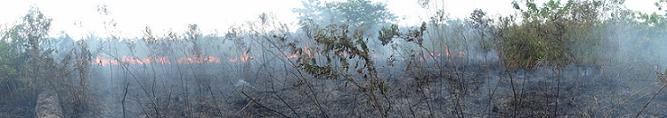
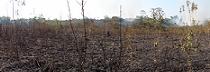
During the dry season months, smallholders clear new fields and pastures and leave the slash to dry in the clearing. Towards the end of the dry season, generally between the last weeks of August through September and early October, and at times up to early November, they burn the fields. In the same period, large pastures are burned.

The first data collection activity will establish a baseline of data on households, their size and composition, on rural and urban residence and visits made to the city, migration histories, and uses of fire, including how and by whom decisions are made to burn, who else is informed and what measures, if any, are used to ensure “safe” fires. We will also obtain baseline data on the history and extent of escaped fires, crops and property lost to fires, compensation (if any) paid, community implementation of fire control methods, and historical land configurations and land-use. Our schedule of field data collection is designed around the burning season from March – June 2011 and 2012. In addition, we will use GPS to locate individual farms, large scale agricultural land parcels, and pastures.

Throughout the project we will collect and compile data available from archival sources, especially in the cities of Pucallpa and Iquitos. We will focus on the histories of regional settlement, land-use policy and land-use change. We will also gather information on socioeconomic variables that may have influenced agricultural commodities and the development of lands and communities in Ucayali.

Climate data and analyses

A first set of activities will be focused in establishing daily rainfall datasets for the study region with as many weather stations as possible. We will look for stations with the longest historical records in order to characterize different temporal scales of observed climate variability (inter-annual, decadal, longer term).

Analyses will be conducted to statistically characterize the observed changes in the total annual rainfall, rainfall seasonality (e.g., dryer dry seasons) and variability (e.g., more frequent and/or longer dryspells—consecutive days with no rainfall). This will allow us to assess which climate variables to use in the fire incidence model and in the development of climate scenarios.

Remote sensing data

We will assemble a time series of Landsat data from the early 1990s to the present for each of the study areas. The land cover change will be identified using a decision tree classifier (Hansen et al. 1996), a standard approach in image analysis. We will identify the land cover (plantation, forest, cropland) based on field data and phenological signal (Morton et al. 2006). Each study area will be characterized according to the size of clearings, land use following clearing, and land use history. Very high resolution data, such as Quickbird, will allow additional calibration and validation.

The active fire product from the MODIS (Moderate Resolution Imaging Spectroradiometer) sensor (Justice et al. 2002) will provide a time series of fire over the study sites. These data will allow us to quantify the fire frequency and persistence associated with small-scale farming, large cropland areas, large pastures, and plantations. Remotely sensed active fire data will be confirmed in the field for a subset of fires. Depending on the validation of the fire data with field data, we will subsequently overlay observations of active fire on classified images of the study areas to quantify the fire associated in each land use type. In combination with the field data, these observations will help quantify the land use adjacent to the escaped fires.

Modeling fire incidence

To project fire activity in the study region, we will rely on time series data of fire activity detected using remotely sensed images or recorded from the ground to predict the number of fires within each farm and area burned as a function of physical, environmental, and social factors. Since our unit of analysis (response variable) is the number of fires in farm per year, we will not model spatial contagion or fire spread. We will obtain climate data as described above. Road data is available from the regional government. We will use a mixed effects model to understand the dependence of fire occurrence on physical and social variables. We will use logistic regression together with historical land use data from our surveys to assess whether on land abandonment to determine whether increasing fire incidence leads to increased probability of land abandonment.