In the debate over the relevance of the feedforward model to the origin of orientation selectivity, evaluating the strength of the geniculate excitation to simple cells has become as critical as understanding its spatial organization. Whereas the feedforward model relies on the geniculate projection to provide the predominant excitatory input to simple cells, alternative models, particularly excitatory feedback models of orientation selectivity (see below), assume that the geniculate input is relatively weak and poorly tuned for stimulus orientation compared to inputs from other cortical cells. Anatomical estimates vary widely for the proportion of the total excitatory input in layer 4 contributed by geniculate terminals. Peters and Payne (1993) calculated the proportion to be 5%, judging from the estimates of the density of cells found there, the total number of synapses per cell, the total number of geniculate neurons, and the number of boutons formed by each geniculate arbor. Ahmed et al. (1994) identified geniculate boutons in the electron microscope by their size, after labeling a small sample of them and finding that they were far larger than those originating from other sources. From their counts, they estimated that geniculocortical inputs made up 6% of the population in layer 4. LeVay and Gilbert (1976) and Einstein et al. (1987) counted the proportion of excitatory terminals in layer 4 that were labeled autoradiographically after radioactive tracer injections into the LGN. These counts of directly identified afferent terminals yield the highest numbers of all, between 22 and 26%.
More relevant to the debate than anatomical measures, however, are physiological measures of the relative strength of the geniculate input. Some types of synapses might generate synaptic drive disproportionate to their number given that their neurons of origin might fire at greater rates than other types, that they may simply release more transmitter, have more or larger postsynaptic channels or be located closer to the soma. In particular, thalamocortical synapses are large and specialized, and hence likely to be particularly effective physiologically (Ahmed et al., 1994). Gil et al. (1999) recently found, in studies of thalamocortical slices from the rat somatosensory system, that thalamocortical synapses are about 5 times stronger physiologically than intracortical synapses within layer 4. Similar results were found in studies of cat visual cortical slices in which putative geniculocortical synapses were identified in response to white matter stimulation (Stratford et al., 1996).
The first in vivo physiological estimates of the strength of the geniculate input came from cross correlation studies. Tanaka (1983) and Reid and Alonso (1995) found that a single geniculate afferent could account for between 1% and 20% of the spikes in a simple cell, judging from the proportion of simple cell spikes that were preceded at monosynaptic latencies by a spike in the relay cell. Given that each simple cell likely receives input from multiple relay cells, the total input from all of the presynaptic relay cells could be stronger still, even taking into account the spike correlations among relay cells (Alonso et al., 1996).
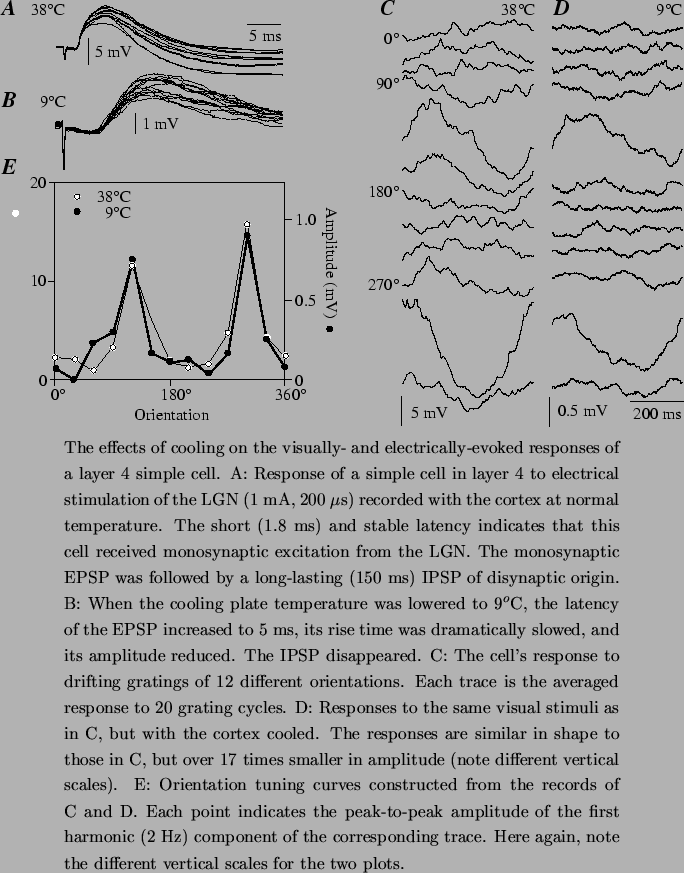
Extracellular measurements of spike correlation are suggestive, but could be confounded by nonlinear effects of threshold or by correlated cortical inputs. Ferster et al. (1996) and Chung and Ferster (1998) measured the contribution of the geniculate input to the responses of simple cells intracellularly, recording visually-evoked membrane potential changes in simple cells while inactivating the surrounding cortical neurons. In the first study (Figure 3), the cortex was inactivated by local cooling around the site of the intracellular recording. Control experiments indicated that during cooling, cortical cells ceased to fire action potentials in response to drifting grating or bar stimuli, with the exception of a small fraction of the spikes deep within the cortex in layer 6. During cooling, therefore, the visually evoked activity recorded intracellularly in simple cells was assumed to be of geniculate origin. This remaining activity ranged in amplitude between 5% and 50% of the normal response to the same stimuli. After correcting for the direct effects of cooling on the amplitude of synaptic potentials originating in the geniculate terminals, these authors estimated that the geniculate input was responsible for generating approximately 35% of the visual responses. The remaining 65% of the responses must therefore originate from intracortical sources, which, given the nature of the measurements could include both excitatory and inhibitory inputs.2
In a second intracellular study of geniculate input (Chung and Ferster, 1998), the cortex was inactivated by electrical stimulation. A single shock to the upper layers of the cortex was found to suppress the response of cortical cells throughout the layers to a briefly flashed, optimally oriented grating. In an important control experiment, the shock also completely suppressed the flash-evoked EPSPs in cortical cells whose input from the LGN was mediated entirely by other cortical cells, a further indication that almost all cortical cells had failed to respond to the visual stimulus. Recordings were then made from simple cells that were known, by their short latency responses to electrical stimulation of the LGN, to receive direct input from geniculate relay cells . Silencing the cortical circuit by local stimulation reduced the amplitude of the visually evoked EPSPs in these cells to an average of 46% of their normal size. The cooling experiment and the shock-inactivation experiment are therefore in approximate agreement, suggesting that roughly 1/3 to 1/2 of the excitatory input evoked in cortical cells originates in the geniculate, with the remaining inputs arising from nearby cortical cells.