Optical and Mechanical Properties of Nanocrystals and Nanomaterials
This effort focuses on the optical and mechanical properties of nanocrystals and nanomaterials.
Also, see
publications, including #75, 79, 82, 84, 85, 87, 88, 91-93, 95, 99-104, 106, 108, 110, 114, 117, 118, 120-125, and 127 for optical properties and #100, 124, and 128 for mechanical properties.
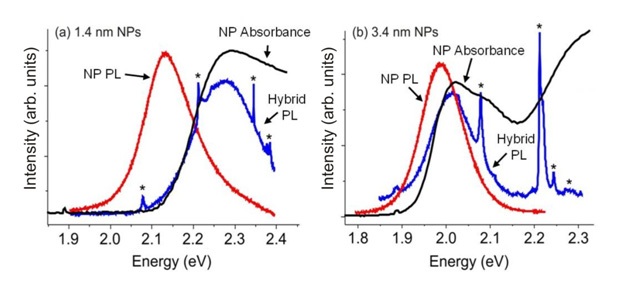
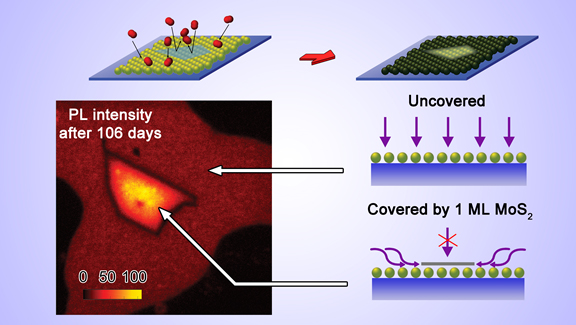
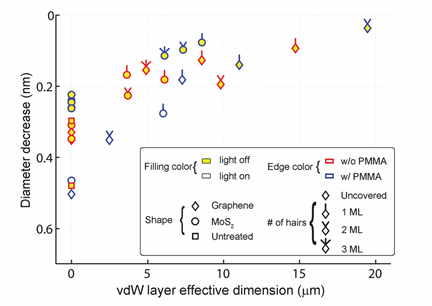
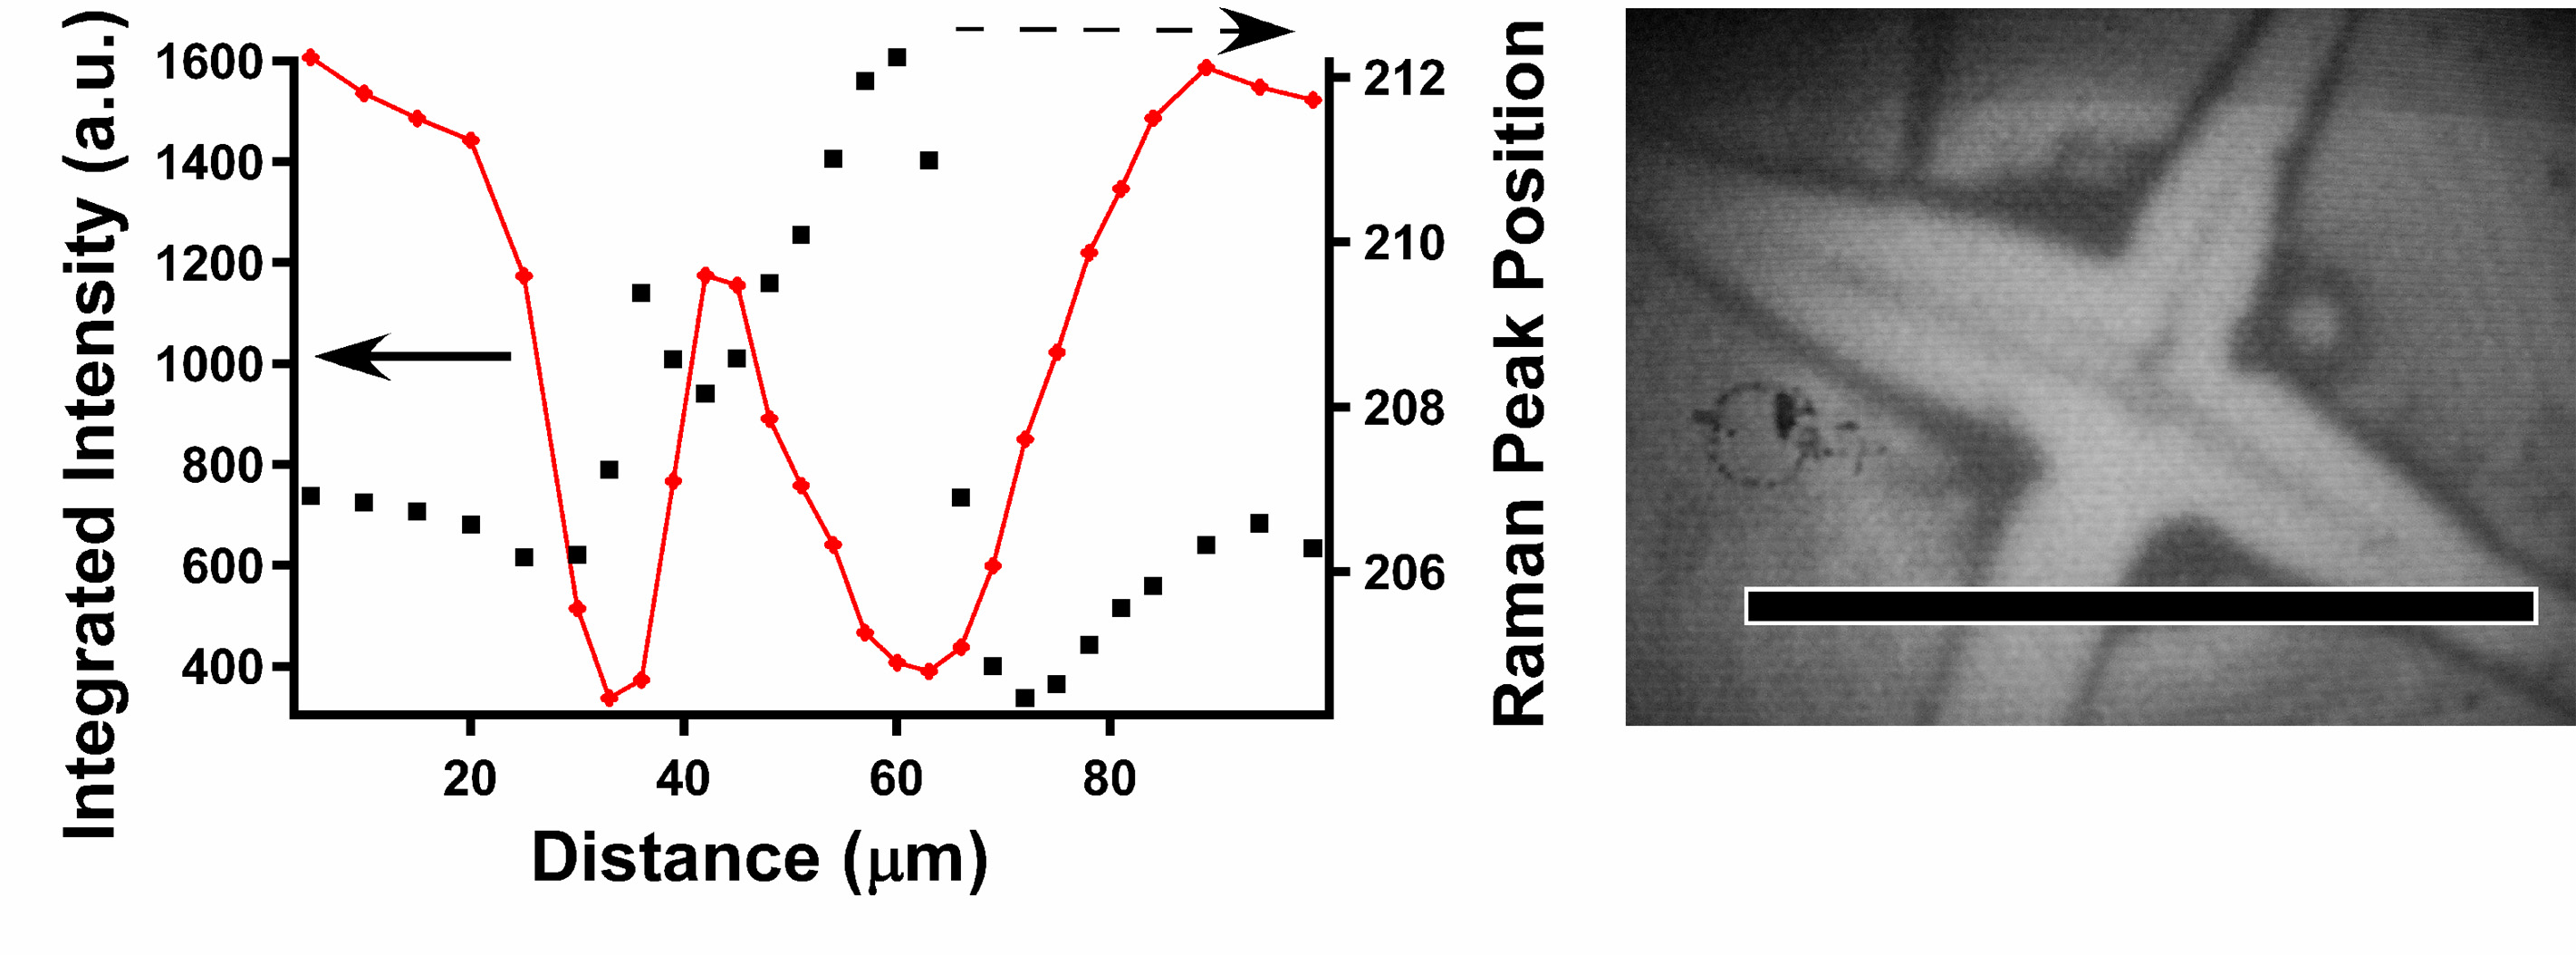
Using Photoluminescence to Monitor Slowing CdSe Quantum Dot Oxidation When Covered by van der Waals Monolayers
CdSe quantum dots can oxidize in air. This leads to a smaller core, and with the greater quantum confinement
a shift of photoluminescence (PL) to the blue. The Herman group used this to show that monolayers of these dots are
passivated when covered by graphene and MoS2 monolayers. The top figure shows the fabrication method
and also that after aging the
PL is strongest nearer the middle of the overlaying vdW layer. The bottom figure shows that the oxidation slows the most when the vdW layer
is the largest. This suggests that oxygen does not penetrate the vdW layer but underneath it (top figure).
For more, see
Passivation of CdSe Quantum Dots by Graphene and MoS2 Monolayer Encapsulation,
D. Zhang, D. Z.-R. Wang, R. Creswell, C. Lu, J. Liou, and I P. Herman,
Chem. Mater. 27, 5032-5039 (2015). doi: 10.1021/acs.chemmater.5b01522
Back to top
|
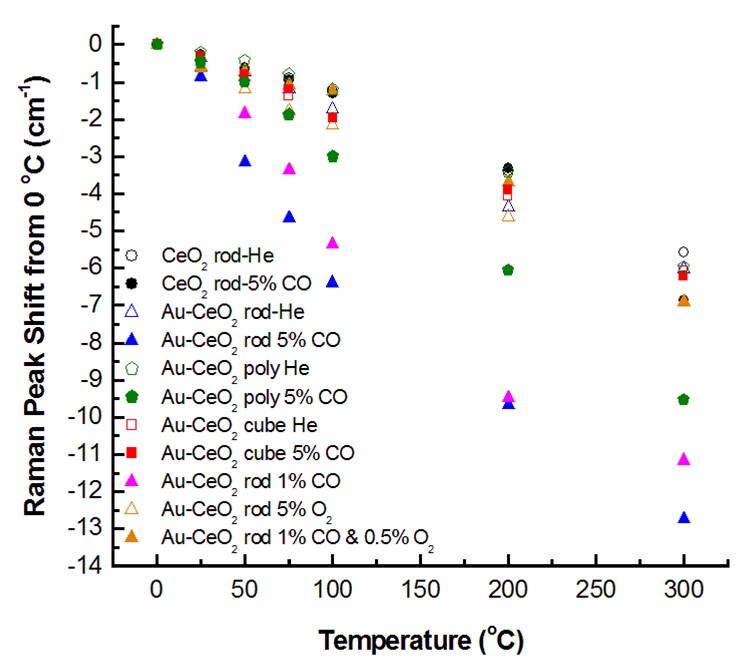
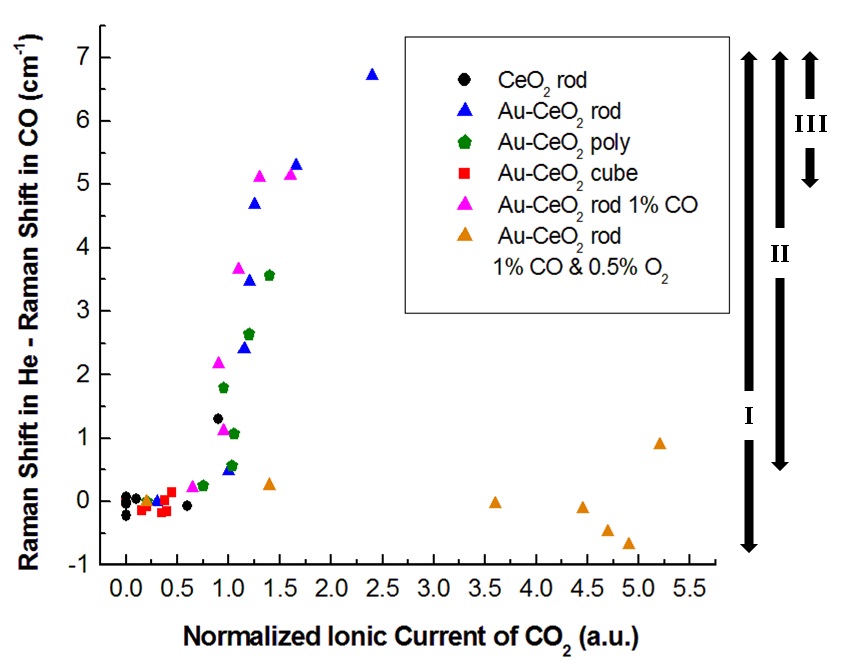
Phonon Softening in Au-Cerium Oxide Nanoparticles during CO Oxidation
Oxygen vacancy levels are monitored during the oxidation of CO by CeO2-δ nanorods and Au-CeO2-δ nanorods, nanocubes,
and nanopolyhedra by using Raman scatter-ing. These materials are important for catalysis of the water-gas-shift reaction to
convert water to hydrogen; ceria is also important for oxygen storage in fuel cells.
The first-order CeO2 F2g peak near 460 cm-1 decreases when this reaction is fast
(fast reduction and relatively slow re-oxidation of the surface), because of the lattice expansion that occurs when
Ce3+ replaces Ce4+ during oxygen vacancy creation. This decrease (bottom three curves in left figure)
is in addition to that normally seen due to thermal expansion and phonon relaxation. This shift correlates with reactivity for CO oxidation,
as is een in the right figure under conditons where net lattice oxygen is consumed.
Increases in the oxygen deficit δ as large as ~0.04 are measured relative to conditions when the ceria is not reduced.
For more, see
Raman Analysis of Mode Softening in Nanoparticle CeO2-δ and Au-CeO2-δ during CO Oxidation,
Y. Lee, G. He, A. Akey, R. Si, M. Flytzani-Stephanopoulos, and I. P. Herman,
J. Am. Chem. Soc. (Commun.) 133 (33), 1295212955 (2011).
.
Back to top
|
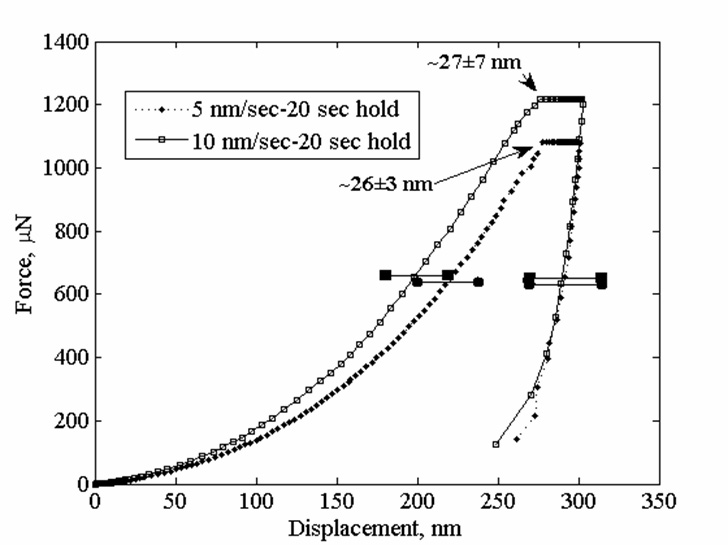
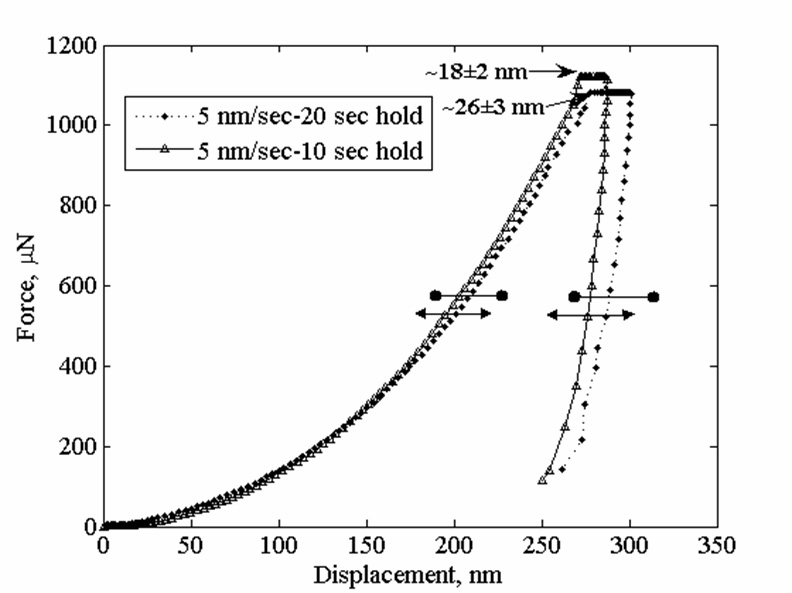
Viscoplasticity and Granular Behavior of Films of CdSe Nanocrystals by Nanoindentation
Nanoindentation studies show that electrophoretically deposited films of CdSe nanocrystals exhibit viscoelastic behavor due to the ligands on the CdSe cores, and so the ligands cause these films to be like polymers. When some of the ligands were removed, the films became more like a granular material. The elastic constant determined by this method agreed with that determined in a complementary study in which we used Raman microprobe analysis of the CdSe cores (see below). This was a collaboration with the Kysar group.
For more, see
Viscoplastic and Granular Behavior in Films of Colloidal Nanocrystals, D. Lee, S. Jia, S. Banerjee, J. Bevk, I. P. Herman, and J. Kysar, Phys. Rev. Lett. 98. 026103 (2007).
Back to top
|
|
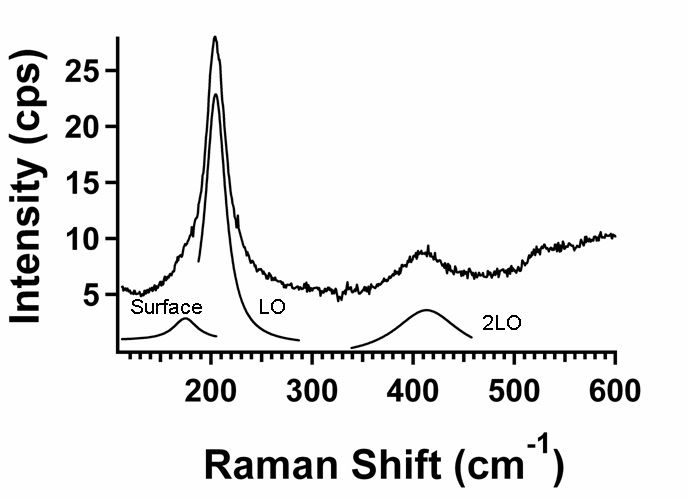
The Raman spectrum of the CdSe cores in electrophoretically-deposited films of CdSe nanocrystals consists of the LO, 2LO, and surface phone peaks (left). By following the frequency of any of these vs. position (the LO peak in the right figure), the strain in the elastic cores can be determined. Using this and film fracture patterns, the strain in the film can be determined and the biaxial elastic constant of the film can be deduced (see above). This was a collaboration with the Kysar group.
For more, see
"Raman Microprobe Analysis of Elastic Strain and Fracture in
Electrophoretically-Deposited CdSe Nanocrystal Films" S. Banerjee, S.
Jia, D. I. Kim, R. D. Robinson, J. Kysar, J. Bevk, and I. P. Herman,
Nano Letters 6, 175-180 (2006).
Back to top
|
Fano Asymmetry in Raman Spectra of SrTiO3 Nanocubes
Raman microprobe scattering shows that there is interference between the sharper phonon resonances in SrTiO3 and related nanocubes and broader, more continuum-like resonances due to ferroelectric interactions, which lead to the asymmetric Fano resonances.
For more, see
Observation of Fano Asymmetry in Raman Spectra of SrTiO3 and Related Perovskite Nanocubes, S. Banerjee, D.-I. Kim, Y. Mao, R. D. Robinson, S. S. Wong, and I. P. Herman, Appl. Phys. Lett. 89, 223130 (2006).
Back to top
|
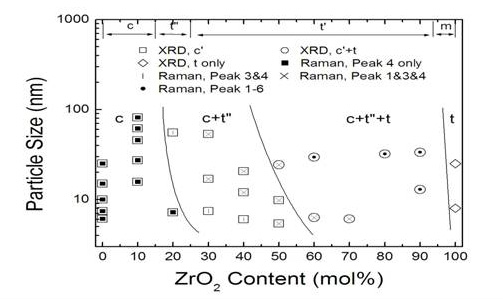
Raman Scattering and Phases in CexZr1-xO2 Nanocrystals
Raman scattering can provide structural information that complements x-ray diffraction. The Herman group in collaboration with the Chan group used these methods to determine the phase of ceria/zirconia alloy nanoparticles vs. nanoparticle size, which resulted in the below phase diagram. Since x-ray scattering is more sensitive to the higher Z metal cations the lower Z oxygen anions, it is not sensitive to differences in the structures of the oxygen lattice, while Raman scattering is.
For more, see
"Phases in Ceria-Zirconia Binary Oxide (1-x)CeO2-xZrO2
Nanoparticles: The Effect of Particle Size" F. Zhang, C.-H. Chen, J. C.
Hanson, R. D. Robinson, I. P. Herman, and S.-W. Chan, J. Am. Ceram.
Soc., 89, 1028-1036 (2006).
Back to top
|
|
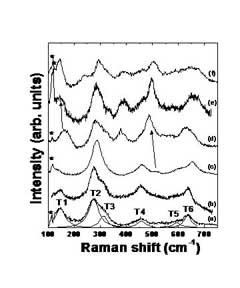
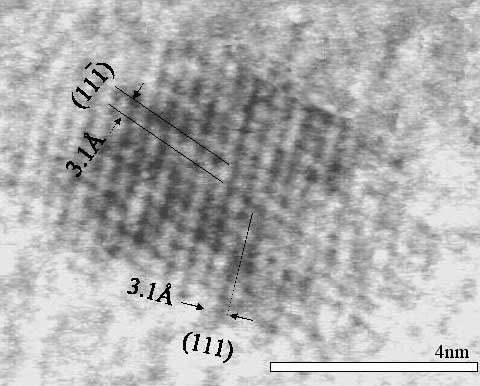
The Herman group is using Raman scattering to examine how composition and nanocrystal size affect the phase of HfxZr1-xO2 nanocrystals. Raman spectroscopy demonstrates that 5 nm dimension HfxZr1-xO2
nanocrystals prepared by a nonhydrolytic sol-gel synthesis method are
solid solutions of hafnia and zirconia, with no discernable segregation
within the individual nanoparticles. (See the TEM.) Zirconia-rich
particles (lower spectra) are tetragonal and ensembles of hafnia-rich
particles (higher spectra) show mixed tetragonal/monoclinic phases. A
simple lattice dynamics model with composition-averaged cation mass and
scaled force constants is used to understand how the Raman mode
frequencies vary with composition in the tetragonal HfxZr1-xO2
nanoparticles. These results are also shown. Raman scattering is also
used to estimate composition and the relative fractions of tetragonal
and monoclinic phases. Bulk hafnia and zirconia are in the monoclinic
phase, and have very large dielectric constants (i.e. they are "high K"
materials). The dielectric constants in the tetragonal phase are
expected to be even larger. The use of Raman scattering was
particularly important in this investigation, because the Zr-O and Hf-O
bond lengths are approximately the same and so analysis by XRD is
relatively difficult; Raman scattering easily distinguishes between
zirconia and hafnia. This is a collaboration with the Brus/Steigerwald
group at Columbia and Yimei Zhu at Brookhaven National Laboratory.

For more, see
"Raman Scattering in HfxZr1-xO2 Nanoparticles" R. D. Robinson, J. Tang,
M. L. Steigerwald, L. E. Brus,, and I. P. Herman, Phys. Rev. B 71,
115408 (2005).
Back to top
|
|
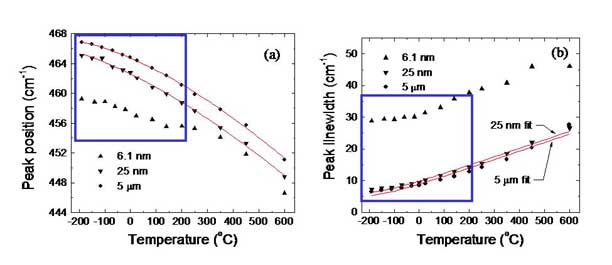
The frequency
shift and linewidth of Raman scattered light is determined, in part, by
how the scattered phonon couples to lower energy phonons. The faster a
phonon decays into lower energy phonons, the broader the phonon
linewidth. This affects the Raman spectrum at any temperature, and
leads to more pronounced changes in the shift and the width with
increasing temperature. Aside from annealing effects (the affects of
which are seen outside the blue boxes), the figure shows that the
changes in the Raman shift and linewidth with temperature in CeO2-x
nanocrystals (see below) does not depend on temperature. This means
that, at least in these cerium oxide nanocrystals, phonon coupling and
decay do not depend on particle size. are important in catalytic
processes. These nanocrystals were synthesized by the Chan group.
For more, see
"Size-Dependent Properties of CeO2-y Nanoparticles as Studied by Raman Scattering,"
J. E. Spanier, F. Zhang, R. D. Robinson, S.-W. Chan, and I. P. Herman, Phys. Rev. B 64, 245407(1-8) (2001).
Back to top
|
|
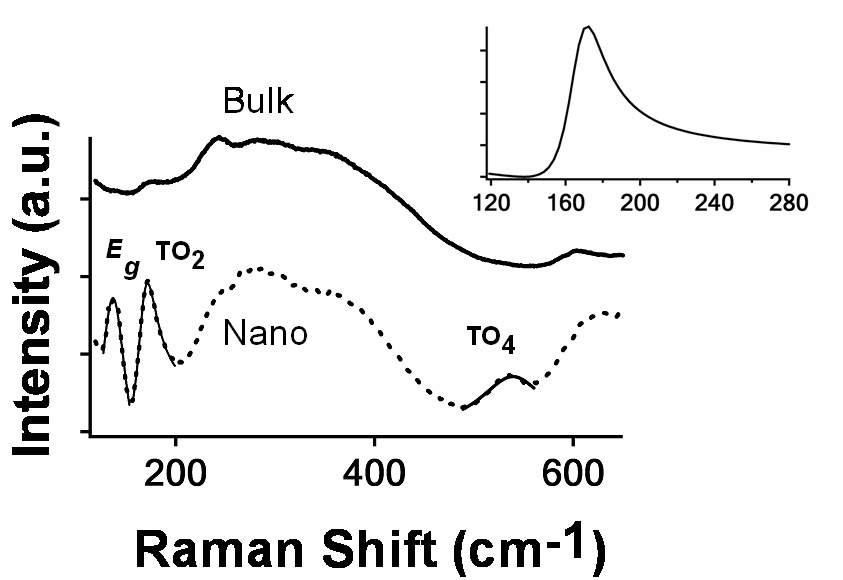
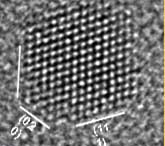
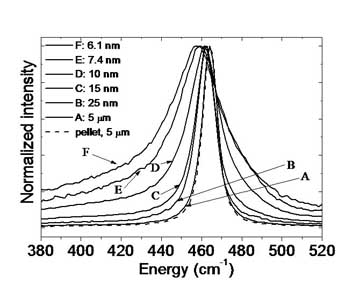
Cerium oxide nanocrystals are important in catalytic processes. (See the TEM.) The composition of cerium oxide is CeO2-x;
as the particle size gets smaller, the larger x becomes. With more
oxygen defects, the catalytic properties improve. The Herman group has
been examining these nanocrystals by Raman scattering, in collaboration
with the Chan group. The displayed Raman spectra become broader and red
shifted as the particles become smaller for two reasons. Phonon
confinement becomes more important in smaller particles, and more of
the bulk dispersion curve is sampled. Also, the lattice constant
increases with smaller size because the larger Ce3+ ions replace the smaller Ce4+ ions as x increases. Any size inhomogeneity leads to a frequency down shift.
For more, see
"Size-Dependent Properties of CeO2-y Nanoparticles as Studied by Raman Scattering,"
J. E. Spanier, F. Zhang, R. D. Robinson, S.-W. Chan, and I. P. Herman, Phys. Rev. B 64, 245407(1-8) (2001) and "Cerium Oxide Nanoparticles: Size-selective Formation and Structure Analysis,"
F. Zhang, S.-W. Chan, J. E. Spanier, E. Apak, Q. Jin, R. D. Robinson, and I. P. Herman, Appl. Phys. Lett. 80, 127-129 (2002).
Back to top
|
|
The densities of
surface ligands and solvent molecules are being followed during the
self-assembly of CdSe nanocrystals into arrays by using
multiple-reflection attenuated total internal reflection (ATIR)
spectroscopy. This is performed in a Fourier transform infrared (FTIR)
spectrometer in which the arrays formed on a ZnSe prism. During the
self-assembly of CdSe nanocrystals passivated by pyridine that are
dissolved in pyridine, the 1436.1 cm-1 peak of neat pyridine is followed along with that at 1445.2 cm-1 due to pyridine bound to the CdSe surface (below).

The
solvent evaporates in about 30 minutes during the self-assembly of
~200-monolayer thick arrays in an argon ambient (inset below). The
pyridine bound to the surface slowly leaves the surface (inset, open
symbols), but about 35% remains after drying for several days (main
figure, below). Since pyridine only weakly binds to the surface, it had
been commonly thought that no pyridine would remain after extensive
drying. While this is not true, there are still significant changes to
the surface during drying. This result is important for the MRSEC
studies of the self-assembly of arrays and the properties of these
arrays. This monitoring method is also being used to follow the surface
of exchange of TOPO and pyridine ligands, and related processes.

For more, see
"Organic Ligand and Solvent Kinetics during the Self Assembly
of CdSe Nanocrystal Arrays using Infrared Attenuated Total Reflection,"
B. Kim, L. Avila, L. Brus, and I. P. Herman, Appl. Phys. Lett. 76,
3715-3717 (2000).
Back to top
|