Global Temperature — More Figures
Currently maps cannot be updated.<> <> <> <> <> <> <> <>
Summary Figures

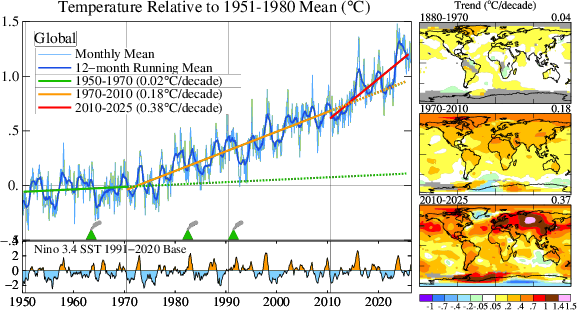
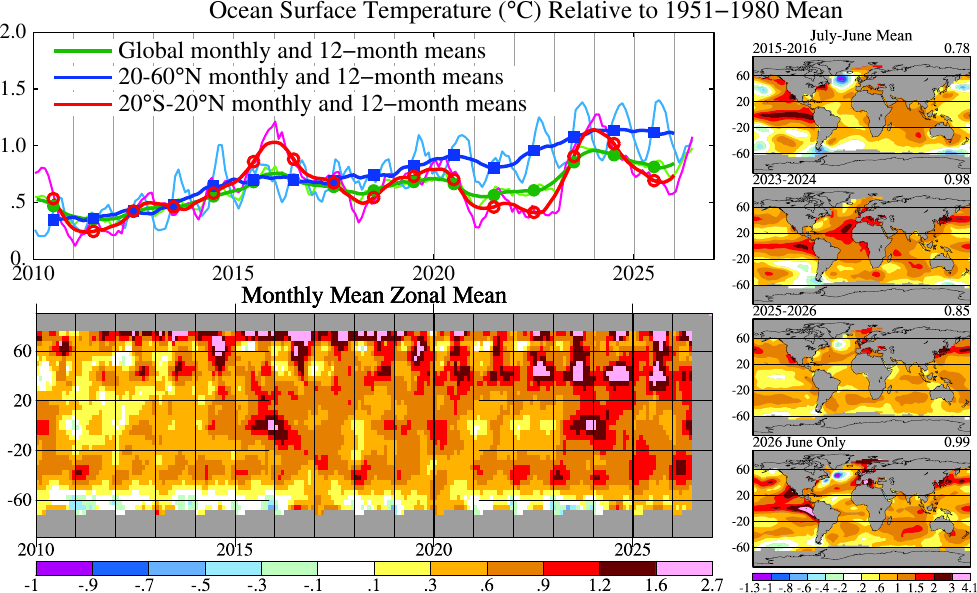
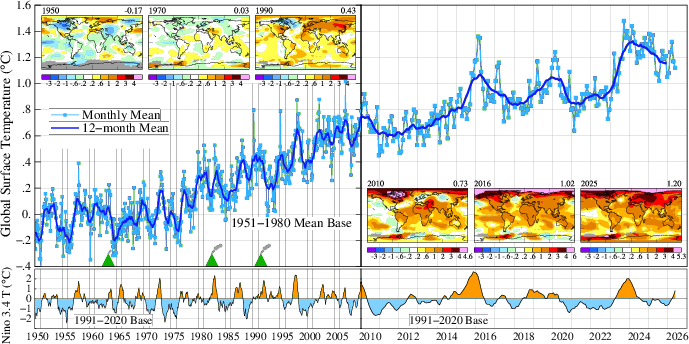
Monthly (thin lines) and 12-month running mean (thick lines or filled colors in case of Nino 3.4 Index) global land-ocean temperature anomaly, global land and sea surface temperature, and El Nino index. All have a base period 1951-1980. Figure also available in PDF. The monthly mean temperature anomaly data are available over land (data) and over ocean (data). (Data through May 2026. last updated 2026/06/12, now with GHCN v4 and ERSST v5.)
For Nino 3.4 SST see El Nino/La Nina page (last modified 2026/06/03) for data source and more information.
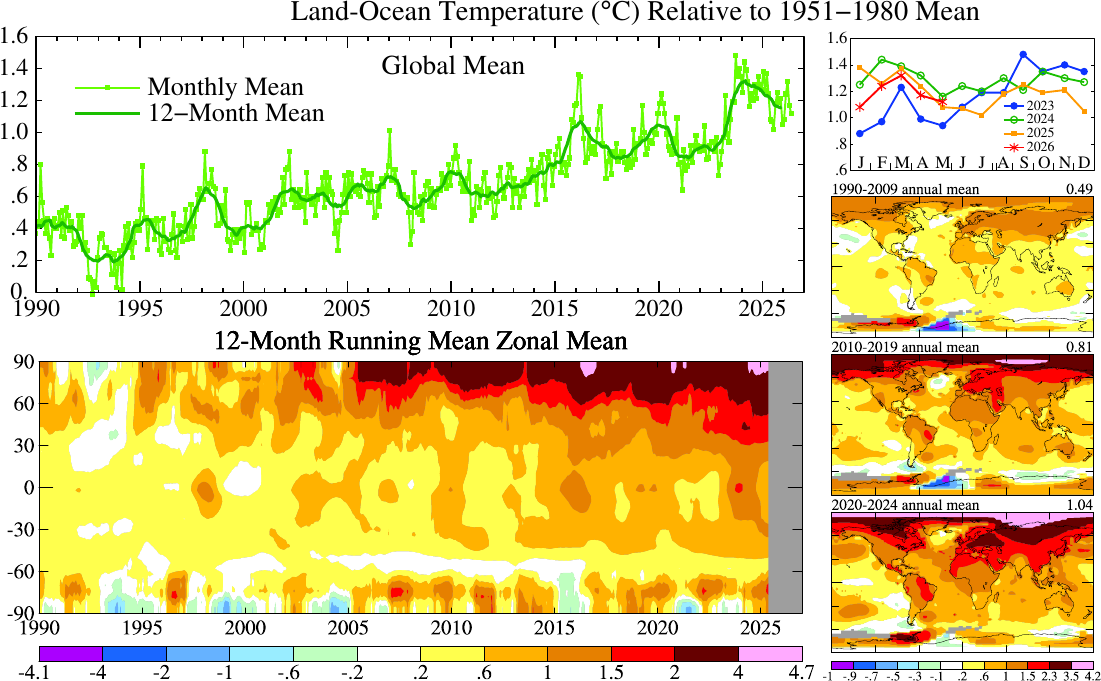
Monthly mean land-ocean temperature with 1951-1980 base period PDF . (2026/06/23)
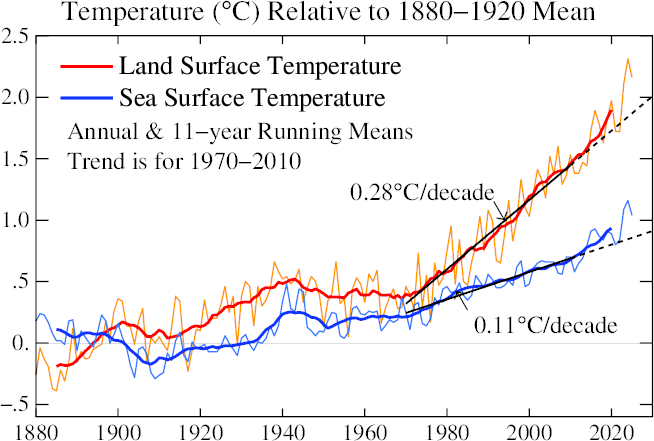
Land and ocean surface temperature with 1880-1920 base period in PDF. (2026/01/21)
<> <> <> <> <> <> <>
Monthly Analysis

Global-mean monthly-mean surface temperature anomalies with the base period 1951-1980. V denotes the major volcanic eruptions, and m and M denote the years of the minima and maxima of sunspot number cycles, respectively. See a NOAA/NGDC page. Figure also available in PDF. (Updated on 2026/06/11) , now with GHCN v4 and ERSST v5.)
<> <> <> <> <> <> <>
Changes in Seasonal Resolution
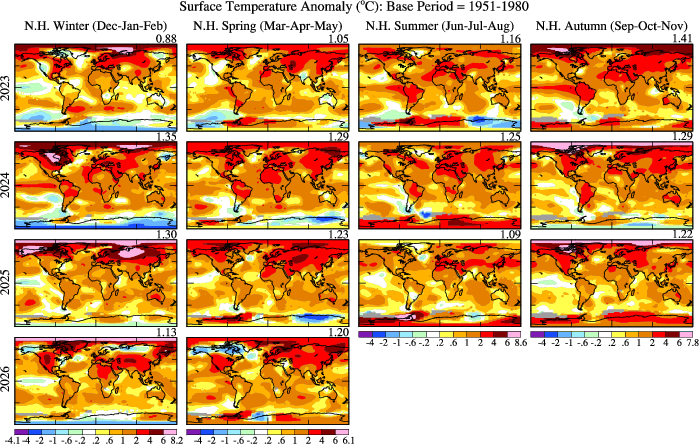
Seasonal mean surface temperature anomaly for 2023-2026. (Updated on 2026/06/14, now with GHCN v4 and ERSST v5)
<> <> <> <> <> <> <>
Annual Analysis
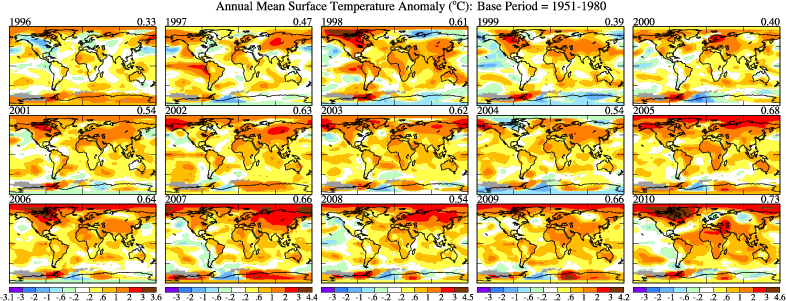

Annual mean surface temperature anomaly since 1996. Now with GHCN v4 and ERSST v5. Updated on 2026/06/11)

Annual mean surface temperature changes based on linear trends. Figure also available in PDF (Updated on 2026/06/11 with GHCN v4 and ERSST v5)

Annual mean surface temperature trend. Figure also available in PDF (Updated on 2026/06/11 with GHCN v4 and ERSST v5)
<> <> <> <> <> <> <>
Decadal Anomalies
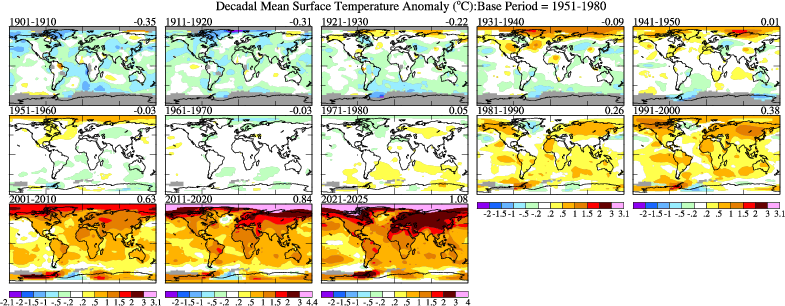
Figure also available in PDF.
(Updated on 2026/06/14, with GHCN v4 and ERSST v5)
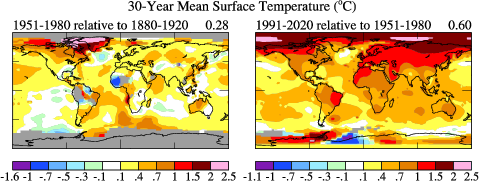
Annual and decadal mean global-mean temperature relative to 1880-1920 mean
<> <> <> <> <> <> <>
Annual Mean, Zonal Mean Changes
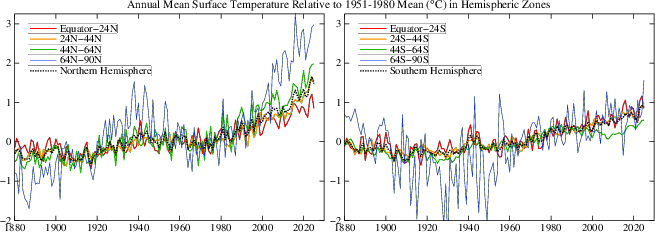 <
<
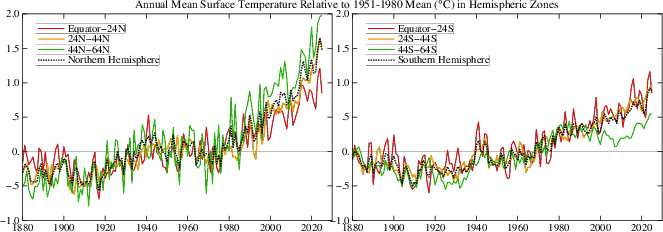
Figures in PDF: with polar regions and without polar regions. (Data through 2025 used. Updated on 2026/06/24 now with GHCN v4 & ERSST v5)
<> <> <> <> <> <> <>
Surface Temperature and ENSO Summary
in PDF (Data through May 2026. Updated on 2026/06/24).
<> <> <> <> <> <> <>
Updates of figures in Hansen, et al. Global temperature change, 2006, PNAS.
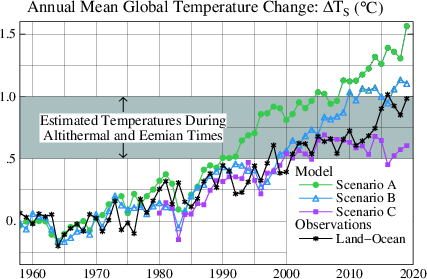
Extended to 2030 and Extended to 2062 (Updated 2026/01/16). Data from Dr. Gavin Schmidt (Updated 2021/01/22)
.
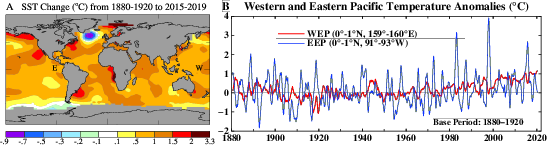
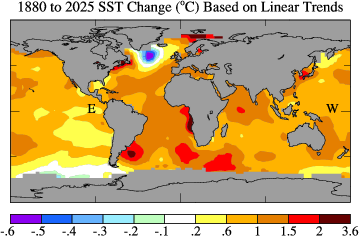
Figure 7 in PDF. (Updated 2026/06/18)

Figure 9 in PDF. Data provided by Dr. Reto Ruedy of NASA/GISS. (Updated 2020/11/30)
.
<> <> <> <> <> <> <>
Today's Weather Maps by Climate Reanalyzer (University of Maine)
-----------------------------------------------------------------------------
All above data source: NASA Goddard Institute for Space Studies, New York, NY,
except several NOAA data sets mentioned above.
(See
data.giss.nasa.gov/gistemp for details and data.)
Note: The Byrd Station data in central West Antarctica were replaced by Bromwich et al's data. (since 2013/03/21)
-----------------------------------------------------------------------------
* * * Snow * * *