Fossil Fuel CO2 Emissions
Total Emissions
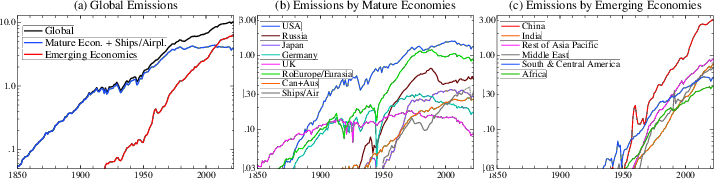
Fossil fuel CO2 emissions by countries and regions for 1850-2022. The bunker fuels are not included. Data source: CDIAC data (1850-2020) and extensions by using EI's energy consumption data for each fuel type (2020-2022).
(a) For the total developed and developing countries and regions.
(b) For developed countries and regions: "Russia" = 0.6 x USSR (1850-1991) + Russian Federation (1992-2018). "Rest of Europe" = CDIAC's [Centrally Planned Europe + Western Europe + Germany + Turkey] - ["Russia" + Germany + U.K.], and Ships/Air = Sum of the bunker fuels of all the countries extended linearly after 2014.
(c) For developing countries and regions: Rest of Asia Pacific = CDIAC's [Centrally Planned Asia + Far East + Oceania] - [China + India + Japan + Australia], Middle East = CDIAC's Middle East - Turkey, S.&Cent. America = CDIAC's Developing America (including Mexico), Africa = CDIAC's Africa.
Note: Missing data before the first year with data are assumed to be zero, and between two data are linearly interpolated. The negative numbers in CDIAC's original data are replaced by zero. [Last modified 2023/12/08]
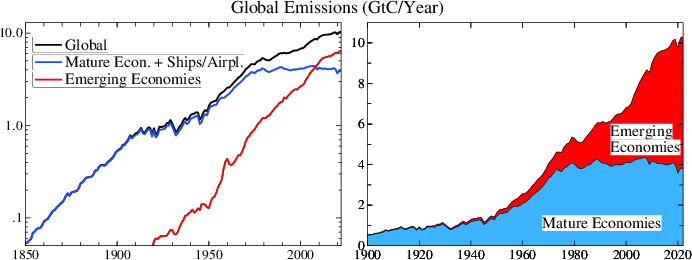
Figure in PDF. Data source: CDIAC (1751-2020)
and EI (2020-2022). [Last modified 2023/12/08]
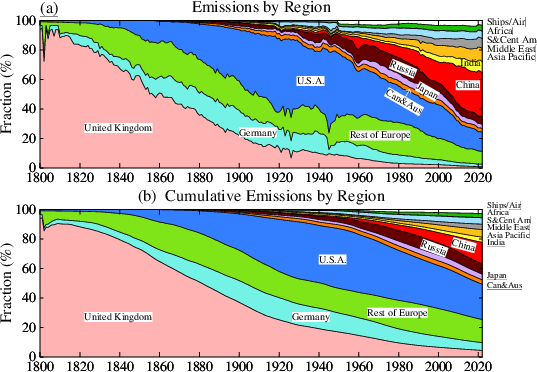
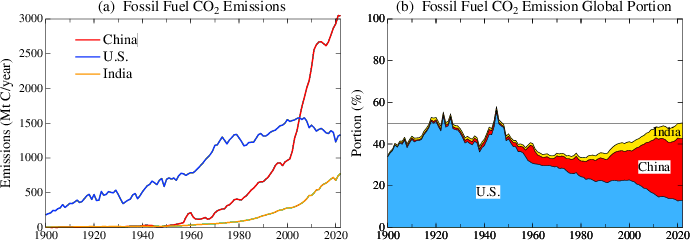
Top: Time series of fraction in % of the countries and regions CO2 emissions
and bottom: cumulative emissions since 1751.
Figure in PDF. Data source: CDIAC (1751-2020)
and EI (2020-2022).
[Last modified: 2023/12/06]
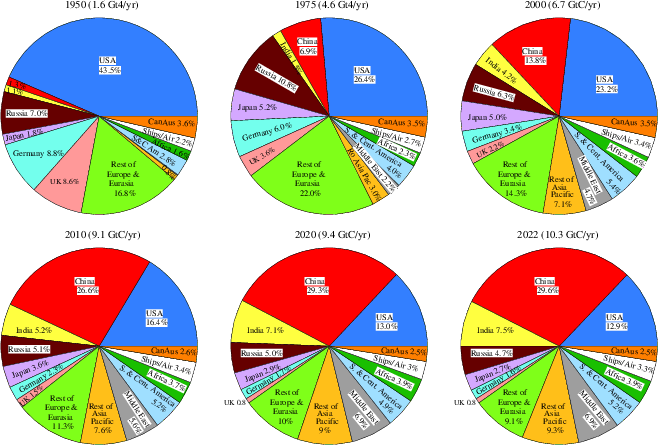
Figure in PDF. Data source: CDIAC (1751-2020)
and EI (2020-2022).
[Last modified: 2023/12/11]
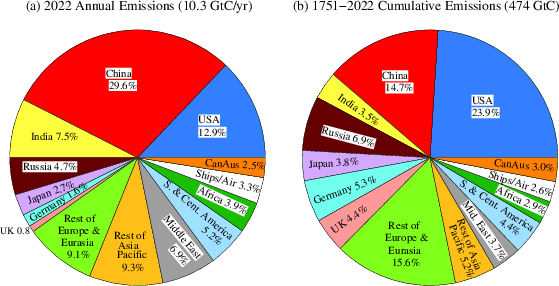
(a) 2020 emissions by source region, and (b) cumulative 1751-2020 emissions
Figure in PDF. Data source:
CDIAC (1751-2020) and EI (2020-2022)
[Last modified: 2023/12/21]
Figure in PDF. [Partially updated on 2023/12/25]
in PDF (Data through 2022, last modified 2023/11/30)
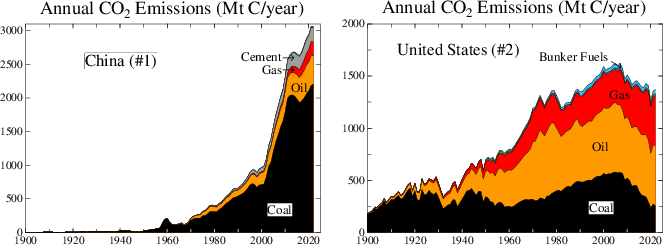
PDF for China, PDF for US (Data through 2022, last modified 2023/12/25)
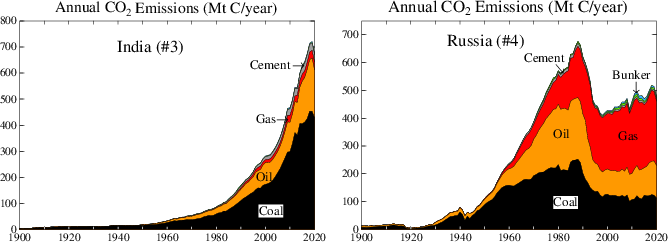
PDF for India, PDF for Russia (Data through 2020, last modified 2021/10/15)
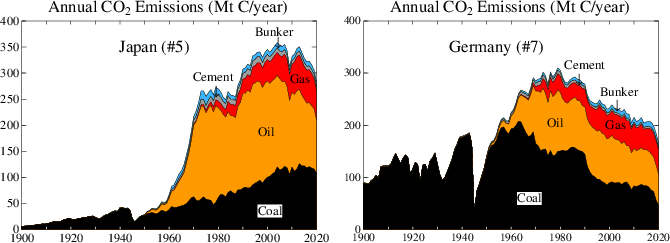
PDF for Japan, PDF for Germany (Data through 2020, last modified 2021/10/15)
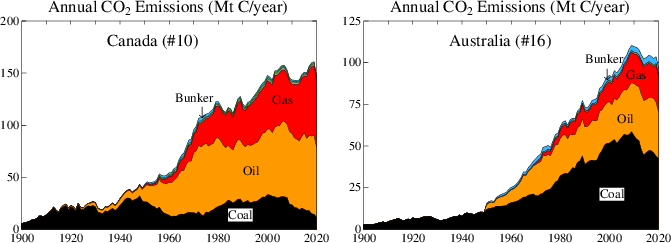
Canada, Australia (Data through 2020, last modified 2021/10/15)
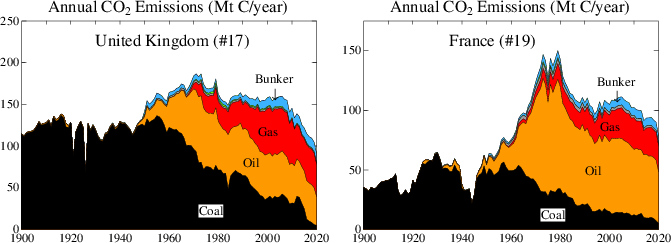
PDF for U.K., PDF for France (Data through 2020, last modified 2021/10/15)
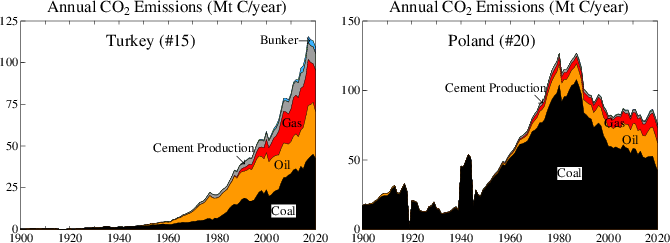
PDF for Turkey, PDF for Poland (Data through 2020, last modified 2021/11/05)
Per Capita Emissions
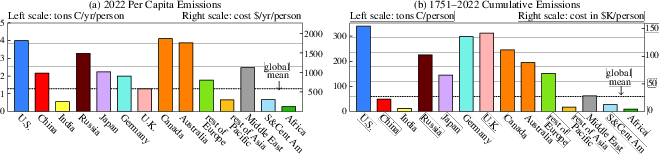
(a) Per capita emissions for 2022.
(b) 1751-2022 cumulative per capita emissions.
Now Turkey is moved from Middle East to the rest of Europe. Bunker fuels (Ships/Airplanes) are included in each country, unlike the pie charts above PDF [Last modified: 2023/12/25]
.