|
Home
About The Atlas
The Geography
Local Government
Physical
Environment
Human Environment
Acknowledgements
Map Center
Gambia Names
Atlas of 2003 Census
Climate Change and Development in the Gambia
Notable Gambians


| |
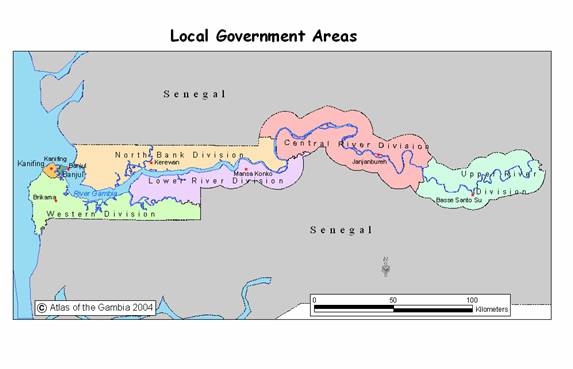
Table 1.
Population of Local Government
Areas between 1963 and 2003
| |
1963 |
1973 |
1983 |
1993 |
2003 |
|
LGA |
Population |
% Total |
Population |
% Total |
Population |
% Total |
Population |
% Total |
Population |
% Total |
|
GBA |
40017 |
3.9 |
78185 |
15.9 |
145612 |
21.2 |
270,240 |
26.1 |
357,796 |
26.3 |
|
W.D. |
55,393 |
17.6 |
91,013 |
18.4 |
137,245 |
20 |
234,917 |
22.6 |
389,594 |
28.6 |
|
LRD |
34,227 |
10.9 |
42,447 |
8.6 |
55,263 |
8 |
65,146 |
6.3 |
72,167 |
5.3 |
|
NBD |
63,045 |
20 |
93,388 |
18.9 |
112,225 |
16.3 |
156,462 |
15.1 |
172,835 |
12.7 |
|
CRD |
64,755 |
20.5 |
101901 |
20.7 |
126,004 |
18.4 |
156021 |
15 |
185,703 |
13.7 |
|
URD |
58,049 |
18.4 |
86,167 |
17.5 |
111,388 |
16.2 |
155,059 |
14.9 |
182,587 |
13.4 |
|
Total |
315,486 |
100 |
493,499 |
100 |
687,817 |
1 |
1,038,145 |
100 |
1,360,681 |
100 |
Source: Population and Housing Census, Central Statistics
Department, Banjul, The Gambia
| |
|