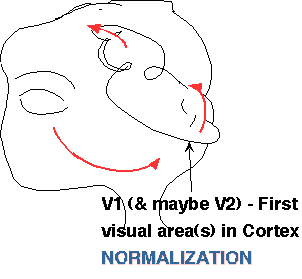

In a normalization network the response of one channel/neuron is "normalized" by the total response from a group of channels/neurons. Normalization seems to be the intensive nonlinearity important in visual texture segregation and similar perceptual tasks.It is a form of contrast gain control.
The physiological substrate for normalization in our texture segregation tasks is probably inhibition among neurons in cortical area V1 or V2 , but normalization probably occurs in other cortical areas as well.
What is on this page? To go to a section below on this page you can click here in this table of contents or scroll. - Inhibition among channels (normalization)
- Functions of normalization -- more generally, of contrast gain controls
- Current version of our model for texture-segregation tasks
- Simple-equation approach to static normalization in texture-segregation model
- How normalization (inter-channel inhibition) can explain the poor perceptual segregation of same-sign-of-contrast element-arrangement textures
- Why is there expansiveness in some of our constant-difference-series results?
- The properties of the intensive nonlinearity in texture segregation described within the framework of the normalization model
-Possible late within-channel contrast-gain controls
The known inhibitory influences among cortical neurons suggests there might be inhibition among the multiple analyzers or channels postulated in psychophysical models. Indeed, although inhibition among analyzers has NOT proved necessary in the successful model of near-detection and identification experiments, a certain amount of evidence from these near-threshold experiments, while not being conclusive, is at least suggestive of inhibition. See Ch. 12 of Graham (1989) or summary in right column of table from Graham (1992).
For suprathreshold phenomena, inhibition among analyzers (channels, etc) has been suggested by a great number of investigators for a number of phenomena. For reasons described below, we feel that such inhibition is necessary to describe our results with texture segregation.
Neurophysiological recordings from cortical cells produce results that are often described as cross-orientation or cross-frequency inhibition. Further, the relationship between stimulus contrast and cortical cells' responses is known to be very compressive. Some cortical cells show compression at 10-20% contrast. Robson (1988a,b) and Heeger and his colleagues (Heeger & Adelson, 1989; Heeger, 1991; Carandini et al, 1997) pointed out that both the intracortical inhibition and the response compression may result from the same process, a normalization process which keeps the total response from some set of neurons at or below a ceiling. It accomplishes this by doing something like dividing (normalizing) the response of each individual neuron by the total response from a set of neurons. This is a contrast-gain control since it resets the operating range (for a single neuron) depending on the overall contrast level (the pooled response from the normalization pool).
Refs:
Heeger, D. J. (1991) Computation model of cat striate physiology.
In Computational Models of Visual Processing (M.S. Landy
and J.A. Movshon, Eds.) Cambridge, MA: MIT Press.
Heeger, D.J. and Adelson, E.H. (1989) Mechanisms for extracting
local orientation. In Supplement to Investigative Ophthalmology
and Visual Science, 30, 3, 110.
Carandini, M., Heeger, D.J., and Movshon, J.A. (1997) Linearity
and normalization in simple cells of the macaque primary visual
cortex. J. of Neuroscience, 17, 8261-8644.
Robson, J. G. (1988a) Linear and non-linear operations in the
visual system. Supplement to Investigative Ophthalmology and
Visual Science, 29, 117.
Robson, J. G. (1988b) Linear and non-linear behavior of neurones
in the visual cortex of the cat. Presented at New Insights
on Visual Cortex, the Sixteenth Symposium of the Center for
Visual Science, University of Rochester, Rochester, New York,
June, 1988. Abstract p. 5.
Why is there normalization or, more generally,
contrast-gain control? What function(s) does it serve (that presumably
caused evolutionary pressure in its favor)?
A number of people have suggested rather different kinds of answers, and perhaps it serves a number of functions. Also there may be a number of different related processes. (Some references are listed below.)
Normalization puts a limit on the total response from the group of neurons that are affected by the same normalization pool; thus it may prevent neurons upstream from being overloaded. Further, as a number of authors have pointed out, normalization accomplishes this while preserving selectivity along dimensions of interest, e.g. orientation and spatial frequency.
By analogy with light-adaptation, one might also think that there would be situations of low average contrast where one would want to discriminate small differences in contrast around some lower mean level and therefore have readapted the whole system to a lower-contrast range. And analogously for high average contrast situations. This may be part of the more general function of adapting to particular values on pattern dimensions (e.g. orientations) to allow better discriminations of changes from that value.
Recently, several investigators have suggested that normalization would also serve to decorrelate the responses of neighboring neurons thus serving to make the coding of natural images more efficient (Simoncelli & Schwartz,1998; Zetzsche, Krieger, Schill, Treutwein, 1998)
Some references for function(s):
Bonds, A. B. (1993). The encoding of cortical contrast gain control. In Contrast Sensitivity, eds. Shapley, R.M. & Lam, D.M., MIT Press, Cambridge, pp.215-230.
Geisler, W.S. and Albrecht, D. G. (1995) Bayesian analysis of identification performance in monkey visual cortex: Nonlinear mechanisms and stimulus certainty. Vision Research, 35, 2723-2730.
Heeger, D.J. (1992) Normalization of cell responses in cat striate cortex. Visual Neuroscience, 9, 181-197.
Lennie, P. (1998) Single units and visual cortical organization. Perception, 27, 889-935.
Simoncelli, E.P. and Schwartz, O. (1998) Derivation of a cortical normalization model from the statistics of natural images. Supplement to Invest. Opthalmol. Vis. Sci, 39, Abstract # 1977.
Victor, J.D., Conte, M.M., and Purpura, K.P. (1997) Dynamic shifts of the contrast-response function. Visual Neuroscience, 14, 577-587.
Zetzsche, C., Krieger, G., Schill, K., and Treutwein, B. (1998) Natural Image Statistics and Cortical Gain Control. Supplement to Invest. Opthalmol. Vis. Sci, 39, Abstract # 1978.
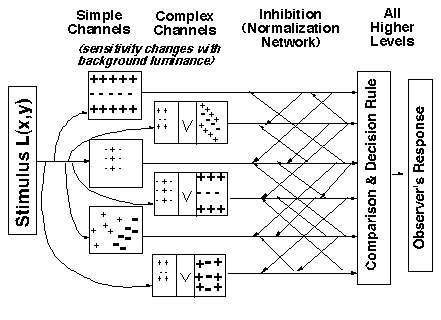
Next, for completeness sake, is a sketch of our full current model, including the decision stage (which must represent all of higher cortex) as well as the simple and complex channels and the normalization (inter-channel inhibition) process.
Notice there is also a sensitivity-setting stage shown before the channels. This includes both the optics of the eyeball and all processes like light adaptation that occur before the channels. Our evidence indicates that the only effect of these stages in our experiments is to set a sensitivity factor for the channels' sensitivity to different spatial frequencies and orientations at different mean luminances. At a fixed mean luminance, the response of each channel is directly proportional to contrast where the constant of proportionality is the sensitivity factor. (In other situations, these early processes have big effects, however, some of which we have been studying. See Light Adaptation page.)
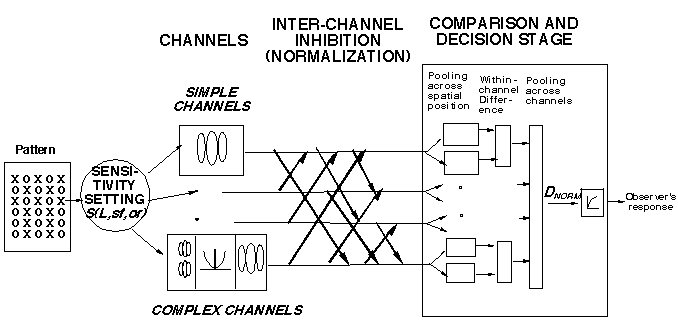
Below is an alternate diagram of the first part of our texture-segregation model, a diagram explicitly representing the normalization pools. The diagram represents the assumption that the inhibitory effects from all the members of the pool can be thought to summate in some fashion in their effect on the inhibited channel. ("Sum" does not necessarily imply linear summation and we consider a family of possible power-summation rules.) For normalization to predict our results (or indeed for it to have the functional properties ascribed to it more generally above) we need to assume that:
The set of cortical neurons in the normalization pool (for any particular neuron) contains neurons having a wide range of different peak spatial frequencies and orientations (spatial position is not crucial).
Following Heeger's approach, and using various approximations appropriate to our situation, relatively simple equations describe the prediction of our current model for texture segregation. (See derivations in Graham and Sutter, 1992, 1996.) The major advantage of these approximate equations is they make it easier for the human investigator to understand why the model makes the predictions it does. One way of writing the equation is:

where the terms in the equation have the following meanings.
DNORM is the difference predicted by the model between the checkerboard and striped regions
The numerator is the signal from channels that can segregate the two regions.
The denominator is the factor by which the normalization process reduces that signal. It contains a pooling of all the channels in the numerator plus other channels. The parameter sigma controls (among other things) possible "explosion" of the predicted value when the numerator gets close to zero.
DS is the difference between regions as computed by the simple channels able to segregate the regions. This is the difference that would exist if there were no normalization. (As it turns out, for element-arrangement patterns, DS can be well approximated as a simple weighted difference between the contrasts of the two element types in an element-arrangement pattern. This is one of the advantages of using texture patterns made up of discrete elements. See Graham, Beck, and Sutter, 1992, for an introduction to this equation and the corresponding ones for complex and other channels.)
DC is the difference between regions as computed by the complex channels able to segregate the regions. This is the difference that would exist if there were no normalization. (As it turns out, for element-arrangement patterns, DC can be well approximated as a simple weighted difference between the absolute values of the contrasts of the two element types.)
RO is the response of "other channels" that are in the normalization pool but unable to see the difference between the checkerboard and striped regions (e.g. channels sensitive to the edges of square elements or the high spatial frequency sinusoids inside a Gabor patch) because they respond approximately equally to both regions. (As it turns out, for element-arrangement patterns, RO can be well approximated as a simple weighted sum of the absolute values of the contrasts of the two element types.)
The exponents kd and kn are the powers in the power-summation rules of the decision and normalization stages respectively. They may both be set to many people's favorite value (i.e. 2) without much loss for our predictions, which turn out not to be sensitive (yet) to this variation.
The observer's perceived segregation as recorded in the experiment is constrained to lie between some finite minimum and maximum (whether experiments were forced-choice or rating experiments) while DNORM can range from zero to infinity. For that reason, among others, the measurement given by the observer is assumed to be a monotonic function of DNORM. We estimate this function in the course of fitting our model predictions to data. (It is shown in the rightmost little box in the diagram above of our current model.)
(To understand this section completely, you may need to first read the Constant-Difference-Series Description page.)
The total amount of contrast in the two elements is greater for same-sign-of-contrast patterns than for the other patterns in a constant-difference series of element-arrangement patterns as can be easily seen in the little diagrams:
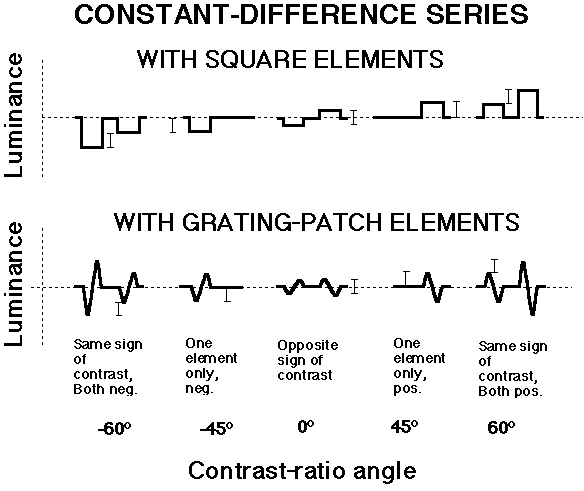
Indeed the total element contrast becomes greater and greater as you go toward either end of a series.
Other channels. The greater total element contrast means that certain channels are responding more and more toward the ends of the series. These are the channels sensitive to the spatial frequencies in the elements themselves (e.g. the edges of square elements, or the high-frequency sinusoidal variation in the grating patches). Fig. 19 of Graham, Sutter, and Beck (1992) show some example computations for actual patterns. These channels cannot segregate the two regions since they respond to the same extent in both regions. (The total element contrast is the same for both checkerboard and striped regions.) So let's call them other channels. They do enter into the normalization pool for the channels that can segregate the textures, however. These are the channels represented by RO in the denominator of the equation above.
(Remember that the channels that can segregate element-arrangement texture patterns are either: simple channels sensitive to the fundamental frequency characterizing the arrangements, or else complex channels having a first stage sensitive to the individual elements and a second stage sensitive to the arrangement frequency. Both these kinds of channels are equally sensitive to all the patterns in a constant-difference series. Thus the numerator of the normalization equation remains constant for all same-sign-of-contrast patterns in a constant-difference-series.)
The larger responses from the other channels for same-sign-of-contrast patterns enters into the normalization pool which (see diagram) inhibits and therefore reduces the size of the response from those channels that can segregate the regions. In terms of the equation (repeated here -- see above for explanation of terms), it enters into the denominator and hence this denominator gets bigger toward the ends of the series. But the numerator is constant for all same-sign-of-contrast patterns. Hence predicted segregation (numerator over denominator) gets smaller toward the end of the series.

To put this qualitative prediction in somewhat different language, the high spatial frequencies in the elements themselves might be said to "mask" the lower spatial-frequency information distinguishing the two arrangements of elements.
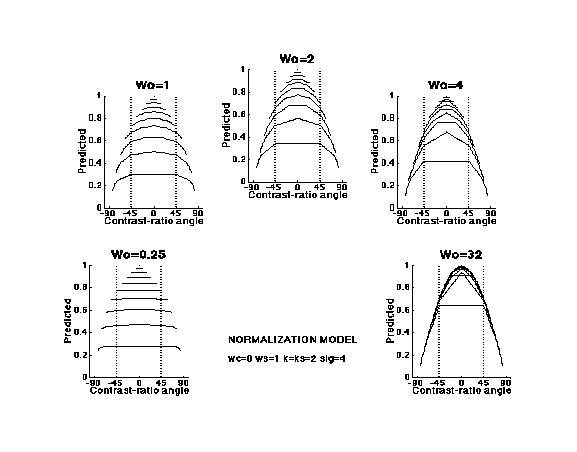
Quantitative predictions from our equations are shown in the next figure. (The panels are distinguished by the weight placed on the responses of the "other channels" in the denominator of the normalization equation. The greater that weight, the greater the normalization effect.) The predictions from this normalization model fit results from individual experiments very well, with typical experimental results (e.g. those on the Constant-Difference-Series page) requiring compression about like that shown in the upper right of the diagram (Graham, Beck, and Sutter, 1992; Graham and Sutter, 1996; Graham and Sutter, 2000, Wolfson and Graham, in press 2004).
The predictions below are for simple channels only. Those for complex channels would show a dip in the middle and also some modest effects of any compressiveness or (more likely) expansiveness at the intermediate nonlinearity. However, the effects of the intermediate nonlinearity are overwhelmed by the normalization process once the contrast is high enough that the normalization process by itself is producing compression. Thus our finding of expansiveness in the area-contrast experiments, which we attribute to expansiveness at the intermediate nonlinearity of the complex channels (on Complex-Channels page) is perfectly consistent with the results of Constant-Difference-Series experiments showing the downturn at the end of the curves. This is discussed somewhat further in the next subsection.
In some constant-difference series experiments' results, particularly with grating-elements, there is expansiveness apparent at very low contrasts (e.g. the example grating results shown on the Constant-Difference-Series Results page). Our current hypothesis to explain this is that the expansiveness in the intermediate nonlinearity of the complex channels may "leak through" at low enough contrasts that the normalization network by itself would still predict linearity. Predictions from a normalization network with complex channels having an expansive intermediate nonlinearity show good agreement with the results (Graham and Sutter, 2000).
Here we briefly summarize the properties of the intensive nonlinearity in texture segregation within the framework of our current model that attributes the intensive nonlinearity to a normalization network (inhibition among the channels). These properties are summarized in another way on the Early-Local-Nonlinearity page within the framework of an (incorrect but useful) early-local model. In some cases the summary there may be more useful to the reader.
Symmetry between increments and decrements (positive and negative contrasts of square elements) is in fact an assumption of the normalization network above. The slight asymmetry found must be accommodated by including it at the sensitivity-setting stage preceding the channels (and indeed a greater sensitivity for decrements is a likely consequence of light adaptation processes. (re #1 on ELN page)
At low contrasts, linearity; At high contrasts, compressive ( logarithmic - only contrast ratio matters!). These properties are built into the formulation of normalization we have used. (re #3 and #5 on ELN page)
The contrast at which compressiveness occurs depends on the relative values of parameters in the model and must be such as to produce effects at twice threshold. (re #2 on ELN page)
At very low contrasts, the expansiveness seen in Constant-Difference-Series results is explained as in the preceding subsection. (re #4 on ELN page)
The normalization pool (inhibition) affects both the simple-channel and complex-channel pathways in the same way. (re #6 on ELN page)
A comparison with the compressiveness of light-adaptation and physiological processes is presented in #7 and #8 on the ELN page.
The normalization network controls contrast gain on the basis of the pooled responses from many channels. Contrast-gain controls residing entirely within a channel have also been suggested. Such a within-channel contrast-gain can NOT explain the experimental results that we are attributing to normalization, but they could exist in the model in addition to normalization and be consistent with our results. For further discussion, see Graham and Sutter, 2000, p. 2754 left column.