
A model containing an early (that is, before the channels), local nonlinearity (but no normalization) must be rejected as a complete explanation of the phenomena showing an intensive nonlinearity in texture segregation. But nonetheless the early-local nonlinearities derived by fitting this model to data can be useful summaries of certain aspects of the texture-segregation data.
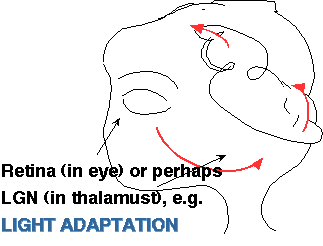
Of course, nonlinear processes that occur before the channels and are relatively local do exist (e.g. light adaptation) and are of interest in themselves (see 4.)
- How early-local pointwise compressive nonlinearity could explain compressiveness in constant-difference-series results
- Strong form of early, local model - Rejected!
- Relatively early-local model - Rejected!
- Using the relatively -early-local model to describe the properties of the intensive nonlinearity in texture segregation1. Increment-decrement symmetry
2. Compressiveness at very low contrasts (twice threshold)
In the Constant-Difference-Series experiments, segregation decreases dramatically for the patterns at the ends of the series, that is, the same-sign-of-contrast patterns. This result indicates there must be a very compressive intensive nonlinearity acting in texture segregation. (For more information about these experiments, see the Constant-Difference-Series page .) When we first obtained this experimental result, we realized there were two classes of known visual processes that might possibly explain these results.
One possibility was inhibition among channels, as in a normalization network. (For more about this possibility, see the Normalization page.)
The other possibility was light-adaptation or similar processes that occur before the channels and operate at each position in the inputs to the channels. This possibility is described, and rejected, on this page. However, using this model allows a convenient summary of many of the properties of the intensive nonlinearity in texture segregation and we do so in the second half of this page.
Further information about our work on Light Adaptation itself is described on another page
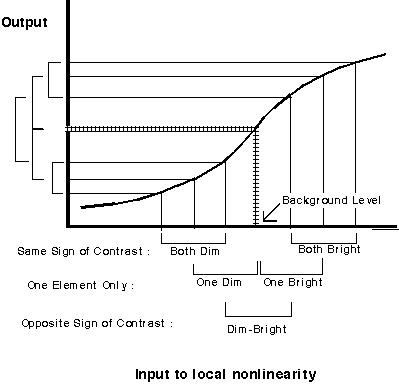
Suppose, as illustrated in the diagram below, that early local light adaptation processes readjust the operating range of the visual system to be centered on the recent luminance -- approximately the background luminance in this case. This maximizes discriminability between luminances near that level and sacrifices discriminability for luminances further away.
Vertical lines extend from these luminances up to the nonlinear early local function (compressive on both ends). And then horizontal lines extend over to the vertical axis to show the outputs of the early local nonlinearity for each pair of luminances.
Note that the difference between the two outputs for the same-sign-of-contrast patterns is smaller than that for the one-element-only patterns, which in turn is smaller than that for the opposite-sign-of-contrast patterns. As the luminances get further away from the background in either direction, this difference gets smaller.
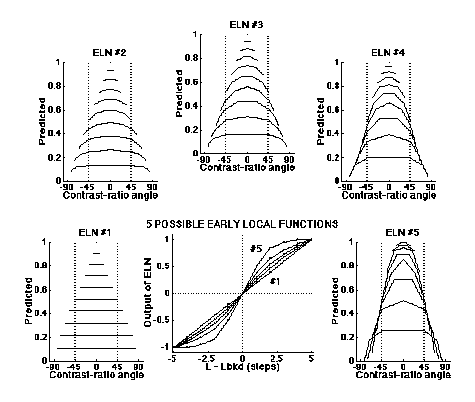
Some quantitative predictions for constant-difference-series experiments based on several different early-local functions are shown in the next figure. (Simple channels only were assumed for these predictions; hence there is no dip in the middle region of this curve.) Notice that, as the early local function becomes more compressive (moving from the panel on the lower left in an arc around to the panel on the lower right), the predicted curves become more curved downward at the ends; that is, the same-sign-of-contrast patterns become less and less segregatable relative to the others in their constant-difference series.
The predictions from this model fit results from individual experiments very well, with typical experimental results (see examples on Constant-Difference-Series page) requiring compression about like that shown by function #4 (Graham, Beck, and Sutter, 1992; Graham and Sutter, 1996).
In the original or "strong" form of the model assuming an early-local nonlinearity, that nonlinearity was assumed to act pointwise on the visual image itself.
This strong form of the model, however, can easily be rejected by the results using different scales of square-element patterns (e.g. the large-regular vs. small-regular cases illustrated on the Constant-Difference-Series Page).
In this modified early-local model diagramed below the intensive nonlinearity results from an early, local (pointwise) nonlinearity that occurs before the spatial-frequency and orientation-selective channels but after a sensitivity-setting stage. This sensitivity-setting might result , for example, from the optics of the eye or from spatial filtering by receptive fields of retinal or LGN neurons.
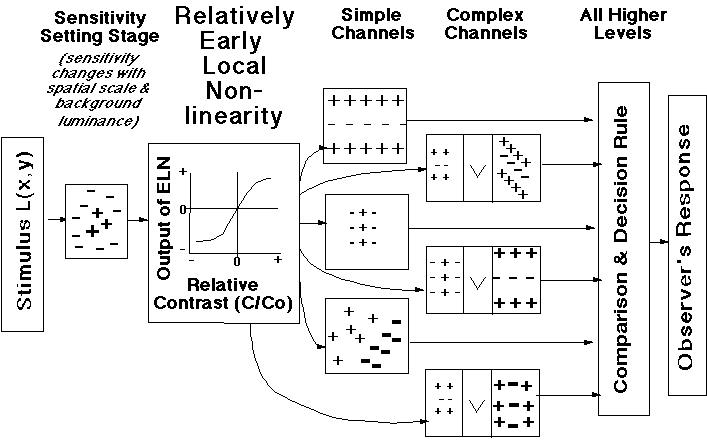
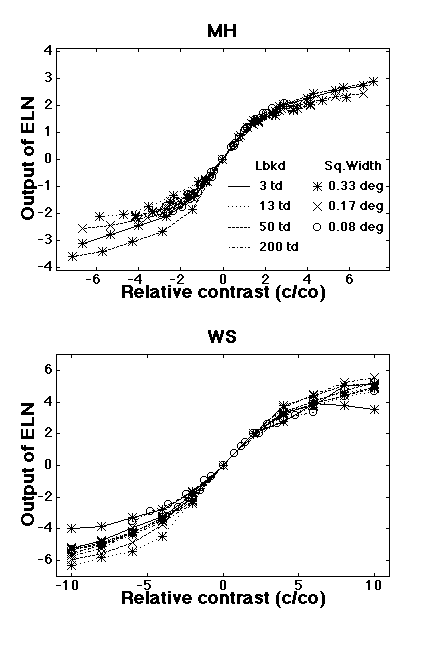
This relatively-early-local model can explain the results that were not explainable by the original form of the early-local model (the results for different scales of square-element patterns, Graham and Sutter, 1996). Indeed, the fact that the different relatively-early-local functions in the first graph below superimpose for different spatial scales and different mean luminances is a demonstration of this.
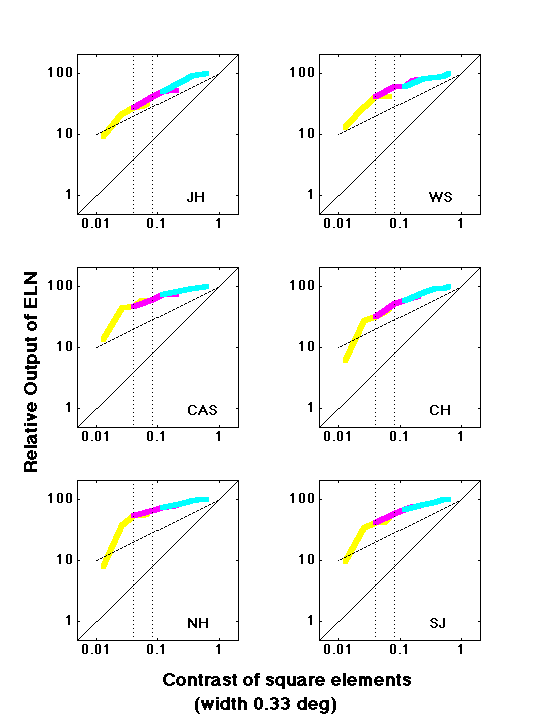
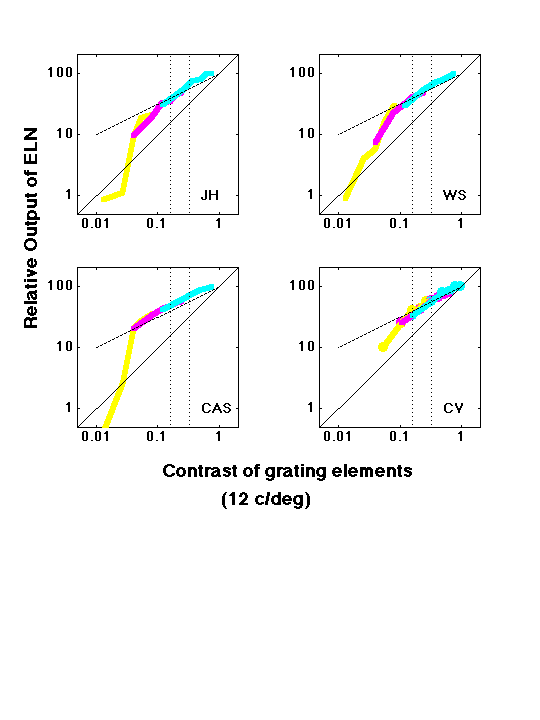
This relatively-early-local model CANNOT, however, simultaneously explain the compressiveness in constant-difference-series experiments results (Graham and Sutter, 2000) and the area-contrast-tradeoff experiments (Graham and Sutter, 1998) done with the same observers in the same conditions. This model predicts that both kinds of experiments must show (approximately) the same degree of compressiveness or else of expansiveness. However, in the same contrast ranges where the constant-different-series results show compressiveness, the area-contrast-tradeoff experiments show linear (for square elements) or expansiveness (for grating elements). This can be seen in the second and third graphs below (those with colored functions). In those graphs, the dotted vertical lines show the contrast ranges from the area-contrast-tradeoff experiments, within which ranges those experiments show behavior implying linear or expansive relatively-early-local functions. However, the colored functions shown, which are derived from constant-difference-series experiments, are clearly compressive within those same contrast ranges (have slopes less than 1.0 of log-log plots).
Although the Relatively-early-local model is unable to correctly explain all of our results, it still provides a convenient way of summarizing certain aspects of the results, particularly those from Constant-Difference-Series experiments. And so we do so here. (See the section on other properties on the Normalization page for a summary in other terms.)
The next figure shows the relatively early local function calculated by fitting the Relatively-Early-Local model to the results of a series of constant-difference-series experiments at different mean luminances using different sizes of regularly-spaced squares (Graham and Sutter, 1996). The contrast on the horizontal axis is plotted relative to the threshold contrast for texture segregation (which is assumed to be set by the sensitivity-setting stage occurring before the relatively-early-local function in the diagram above).
The shape of the function is almost perfectly odd-symmetric. That is, decrements act in the same manner as increments. (In fact, there is a slight asymmetry although it is difficult to see here, it is statistically significant. It is in the expected direction. Namely decrements are slightly easier to detect than increments as if the lowered overall mean luminance caused by the decrements had slightly increased sensitivity.)
As you can see, once the contrast is twice threshold, compression begins.
The next set of graphs show the derived early-local functions plotted against the contrast in the stimulus for another set of experiments (Graham and Sutter, 2002) using square elements (top graph of 6 panels for 6 observers) or 12 c/deg grating elements (bottom graph of 4 panels for 4 observers). The different colors come from three different constant-difference-series experiments run at three different contrast levels. Constant-difference-series plots of the results of some of these experiments are shown in the example results from Constant-Difference-Series experiments.
The early-local-functions below are plotted as logarithmic output from the early-local-nonlinearity versus logarithmic contrast. The solid line has a slope of 1 and the dotted line a slope of 1/2. (A power function, when plotted on log-log coordinates, is a straight line with a slope equal to its power. It is only the slopes of these lines that matter in this discussion - not the intercepts.)
Notice that at relatively high contrasts , the functions below have a slope of approximately 0.5, indicating square-root compression (or approximately logarithmic) behavior. This contrast range showing compression includes that within vertical dotted lines -- which is the range used in the area-contrast-tradeoff experiments with the same observer and conditions (Graham and Sutter, 1998). As mentioned above, however, the area-contrast-tradeoff experiments gave results implying a function with a power of 2 or 3 (expansive). This is the evidence against the relatively-early-local model.
At very low contrasts, some of the examples below have a slope greater than 1. This corresponds to a power function with power greater than 1, and is thus expansive. The function for observer ws with 12 c/deg gratings (upper right panel of second graph) was derived from the results shown in the bottom graph of example grating-element results from Constant-Difference-Series experiments. This expansiveness is particularly clear in results from grating-element patterns although there is some hint of it in the square-element results.
At low contrasts, the derived function goes through a range where its slope is approximately 1 (linear behavior)
Finally, note that the overall behavior is the same for square element patterns, which are primarily segregated by simple channels in our model, and for grating-element patterns, which are segregated by complex channels in our model. Thus the intensive nonlinearity has the same overall properties for simple as for complex channels.
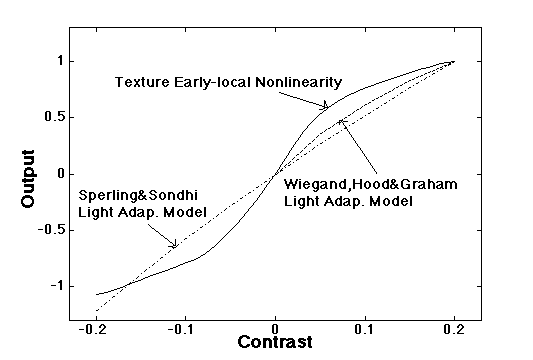
The solid curve below is the early-local-nonlinearity deduced from constant-difference-series results using regularly-spaced square elements of 0.33 deg at a luminance of 200 td. It is the splined median curve from 7 observers. The two other curves are predictions from two light-adaptation models, that of Sperling and Sondhi (1968) and the improved merged model of Wiegand, Hood, and Graham (1995). See Sperling and Sondhi's model or Merged models on Light-Adaptation page. (More details in Graham and Sutter, 1996.)
The physiological functions are from Sclar, Maunsell, and Lennie (1990). More details in Graham and Sutter (1996).
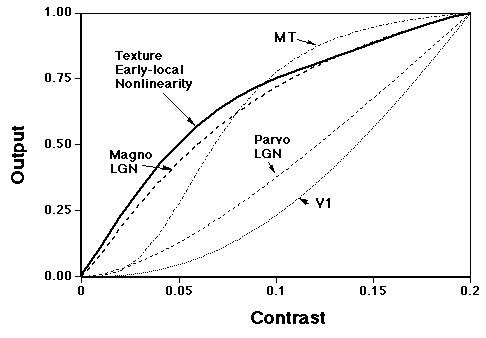
A local (pointwise) compressive nonlinearity occurring before the channels is NOT able to explain simultaneously the compressiveness in the same-sign-of-contrast patterns in Constant-Difference-Series experiments and the expansiveness in Area-Contrast-Tradeoff experiments. Thus it must be rejected as the model for such experiments. (It can, however, serve as a useful summary of various aspects of the results).
Of course, light adaptation processes - a form of local compressive nonlinearity -- do exist before the cortical neurons that are presumably the physiological substrate for the channels. However, these processes seem not to be compressive enough to affect significantly the results of these experiments. (More information about light adaptation itself can be found on the Light Adaptation page.)