Light adaptation allows visual system to operate throughout the vast range of luminance that occurs naturally.
The physiological substrate for light adaptation is probably largely retinal.
What is on this page? To go to a section below on this page you can click here in this table of contents or scroll.
- Function of light adaptation
- Two traditions of investigating light adaptation dynamics
- Merging models from the two traditions
- Probed sine-wave eperiments
----Is the primary processing in these probed-sinewave experiments retinal or cortical?
----A cautionary note: Results from different probed-sinewave studies
----Models with ON & OFF pathways , or Contrast-gain control
----More about proved-sinewave experiments: Rapid adaptation; Increments vs. Decrements
- About quantal noise and decision rules
----About optical blur, spatial vs. temporal frequency filtering, and quantal noise
- Why we started studying light adaptation
- The current status of light adaptation in explanations of our texture results
- Conclusion
The human visual system operates over a very wide range of light levels as the lighting conditions change from a dark night to a bright sunlit noon, at least 10 raised to the 8th power. Yet the dynamic range of neurons is nowhere near this. Further, it is the ratios of light intensities coming from different parts of the scene that remain constant under changes of illumination (neither their absolute values nor their differences remain constant); and thus it is the ratios of luminances that should probably be encoded by the visual system, when possible without losing sensitivity. In other words, contrast (the ratio of the luminance of an object so some measure of average luminance) not luminance is important.
Light adaptation occurs in order to adjust to these changing conditions of illumination. It resets the operating range to be around the current space-time-average light level, allowing good discrimination of levels near that average level (at the expense of poor discrimination between things much darker or much brighter). It probably also ensures that ratios of light levels (rather than, for example, differences) are the main determiner of response.
Light adaptation is commonly thought to occur primarily in the retina. Consistent with this, the outputs of retinal ganglion cells (the "last"neurons in the retina, those having axons that project up to the brain) reflect previously-occurring light adaptation, having a response largely determined by stimulus contrast rather than by luminance of luminance differences (over a wide range of average light levels).
A number of psychophysical paradigms have been interpreted as giving information about these light-adaptation processes. Whether all the results in these paradigms are due to retinal processes is unclear. However, most may well be.
See reviews (references below) for further information.
Hood, D. C. (1998). Lower-level visual processing and models of light adaptation. Annu. Rev. Psychology, 49, 503-535.
Hood, D. C. & Finkelstein, M. A. (1986). Sensitivity to light. In Boff, K. R., Kaufman, L, & Thomas, J. P. (Eds), Visual Psychophysics: Its Physiological Basis. New York: Academic Press.
Shapley, R., & Enroth-Cugell, C. (1984). Visual adaptation
and retinal gain controls. In Osborne, N. N., & Chader, G.
J. (Eds), Progress in Retinal Research (Vol. 3, pp. 263-343).
Oxford: Pergamon Press.
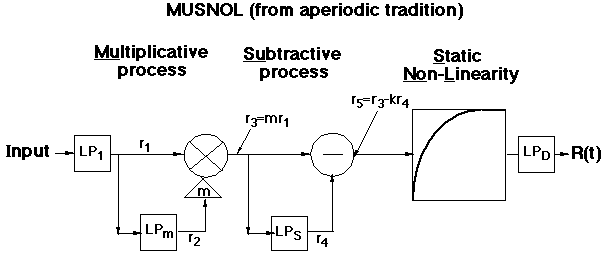
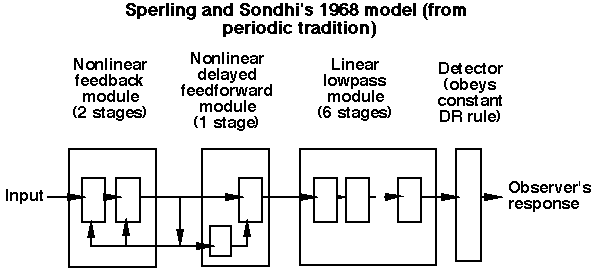
We asked ourselves first whether existing models of light adaptation were good enough to serve in the formulation of models of higher-level processes. We examined candidate models that came from both previous traditions of investigating light adaptation dynamics. The first and older tradition used aperiodic stimuli (e.g. dots and lines superimposed for a short period of time on backgrounds of different light intensity); the second and newer tradition used periodic stimuli (e.g. sinusoidally-flickering lights and spatially-sinusoidal gratings, where the mean intensity of the sinusoids was systematically varied.
Here are two typical models, one from each tradition. (For more details see Graham and Hood, 1992b, or references therein).
We focused on two robust empirical phenomena, one from each tradition:
Background-Onset Effect (from the aperiodic tradition): A test's threshold is highest near the onset of the background light and then decreases
High-Temporal-Frequency-"Linearity" (from the periodic tradition): When amplitude sensitivity for flickering stimuli is plotted as a function of temporal frequency, there is a common high-frequency envelope for curves at different mean luminances.
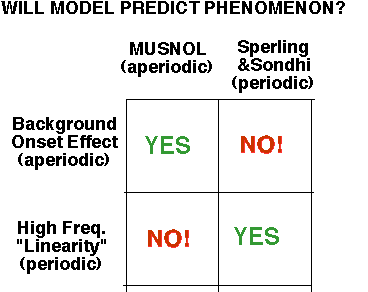
Moral: Each model can only predict the phenomenon from its own tradition.
However, we were able to merge processes from both traditions into models that would successfully predict the phenomena from both traditions. We have suggested three versions of merged models, two that were directly concocted from pieces of the old models (Graham and Hood, 1992b) and another model which had some computational advantages (Wiegand, Hood, and Graham, 1995).
There are three essential components to these merged models:
(i) a frequency-dependent gain-controlling process as in the periodic-tradition models (which predicts veridically the high-frequency "linearity")
(ii) a subtractive process as in the aperiodic-tradition models
(iii) a static nonlinearity that follows the subtractive process as in the aperiodic-tradition models (which, acting together with the subtractive process, predicts the background-onset-effect veridically)
We used these merged models to compare to the potential early-local nonlinearity from texture segregation (see illustration on the Early-Local-Nonlinearity page)
We then went on to test the merged models further in probed-sinewave experiments. In these experiments, the adapting background is a large disk sinusoidally modulated in time, and the test stimulus (the probe) is a brief small spot that can occur at any of 8 temporal positions (8 phases) with respect to the background flicker.
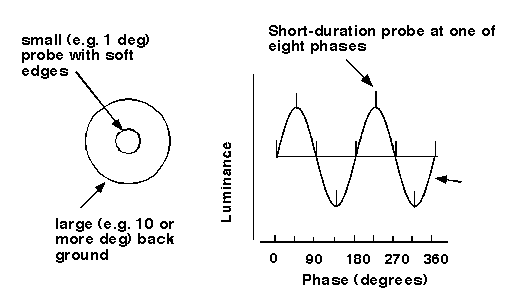
Some data are shown in the figure here (from Hood et al, 1987). Probe thresholds are plotted (vertical axis) as a function of the background phase (horizontal axis) at the time the probe was turned on. The luminance profile of the flickering background is shown as a dotted curve for reference. The straight horizontal dotted line is the value of the probe threshold when measured on a steady background at the same mean luminance as the flickering background. The temporal frequency of the flickering background labels each panel.
Note in particular two aspects of the results:
Shift in phase of peak threshold elevation: At low frequencies the threshold is maximal at 45-90°, leading the peak of the stimulus curve, but shifts higher to near 180° at higher frequencies.
dc (average) component in threshold-vs.-phase curve: The whole threshold-vs.-phase curve shifts upward (there is a "dc shift") as frequency increases from 1 to 8 or 10 Hz and then diminishes again at higher frequencies.
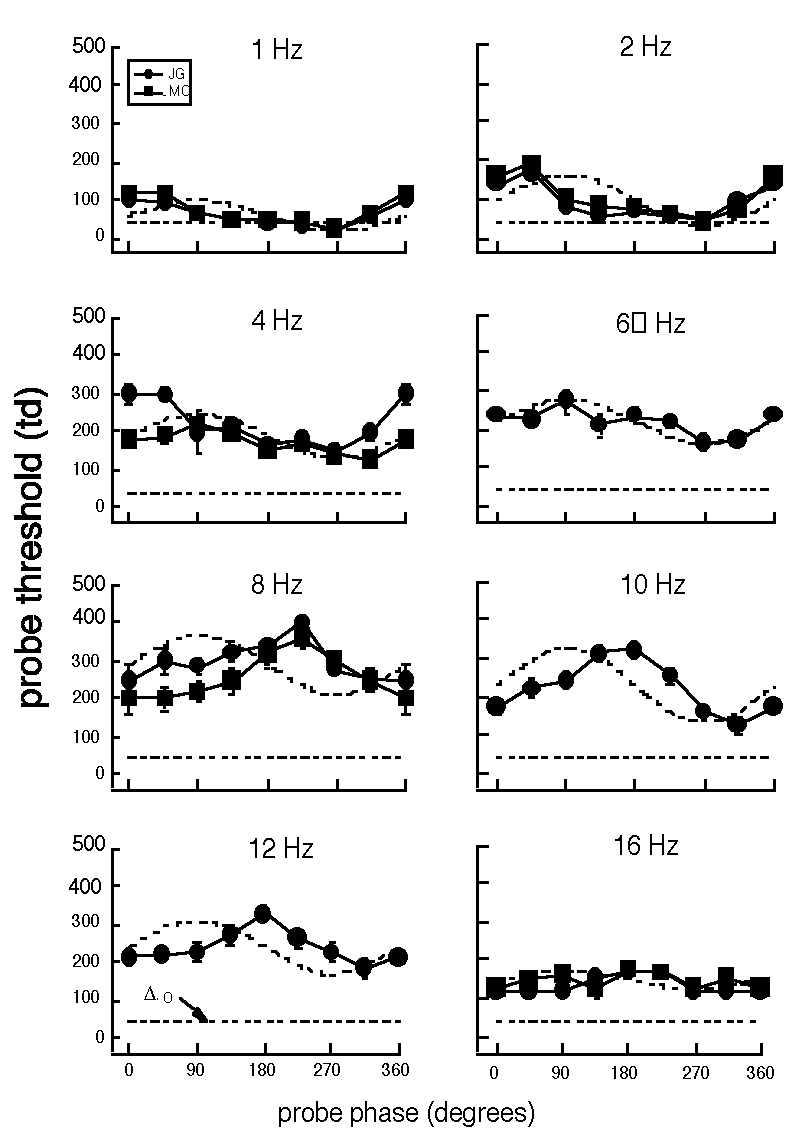
We calculated the predictions of the three merged models (as well as the Sperling and Sondhi and MUSNOL models) for these probed-sinewave results. The models all fail quite dramatically, in particular they failed to predict the two aspects just mentioned.
The failure of these models is so profound it seems unlikely to be corrected without adding further components to the models: perhaps additional channels -- ON and OFF, or P and M; or additional processes within a channel, e.g. a process that is explicitly a contrast-gain control rather than a control based on luminance (Hood et al 1997).
First, however, it seems important to ask whether the primary processing involved in detecting the probe is retinal or cortical. Some of the motivation for conducting this set of experiments comes from wanting to know what sorts of mechanisms should be included/excluded in recent light adaptation models such as those of Snippe et al (2000) and Wilson (1997) described briefly below.
The simplistic logic of the experiments (Wolfson and Graham, ARVO 2001) is as follows. Suppose the adaptation due to the flickering background is primarily retinal. Then, if we present the flickering background to one eye and the probe to the other eye, probe threshold should not be affected by the flickering background.
Our results suggest that most of the processing in the probed-sinewave task is retinal, although there is a small cortical contribution, particularly when the frequency of the flickering background is increased from 1.2 Hz to 9.4 Hz.
We recently compared all published studies known to us that used sinusoidally flickering backgrounds at photopic luminances (Graham and Wolfson, ARVO 2001). These studies were conducted under widely varying conditions over the past 40 years: Boynton, Sturr, and Ikeda (1961, JOSA,51, 196-201), Shickman (1970, JOSA,60, 107-117), Maruyama and Takahashi (1977, Tohoku Psychologica Folia,3, 120-133), Hood, Graham, von Wiegand, and Chase (1997,Vis Res,37, 1177-1191), Wu, Burns, Elsner, Eskew, and He (1997,JOSA,14, 2367-2378), Shady (1999, PhD Dissertation, Columbia University), Demarco, Hughes, and Purkiss (2000, Vis Res,40, 1907-1919), Snippe, Poot, and van Hateren (2000, Vis Neurosci,17, 449-462), and Wolfson and Graham (Vis Res,2001,41, 1119-1131).
In all the datasets the dc-level (threshold averaged over all phases) increases dramatically as the frequency of the flickering background increases and then drops as the frequency continues to increase; the peak occurs between about 8 and 20 Hz.
The shape of the curves collected at low frequencies (approx 2 Hz) is quite similar in all the studies, showing a distinct drop in threshold at the phase when the intensity of the flickering background is lowest. The shape of the curves collected at high frequencies (approx 30 Hz) is also quite similar in the few studies measuring that high. The shape is rather sinusoidal, and it is in phase with the stimulus near 30 Hz but shifted in phase at higher frequencies.
The shape of the curves collected at middle frequencies (approx 10 Hz), however, is NOT consistent across studies, but fall into at least two groups. For example,in some studies the curves have primary or secondary maxima near 270 deg, while in other studies the other curves continue to show minima at 270 deg.
In short: Despite drastic changes in the stimulus parameters (e.g., mean luminance of 31 to 7500 tds, probe size of 46 arcmin to 2 degrees, etc) probed-sinewave results from different studies are quite similar at low frequencies and also at high frequencies of the modulating background; the results are not as stable at middle frequencies (approx 10 Hz).
One possible modification of light-adaptation
models - ON and OFF channels -- are embodied in a recent model
inspired by retinal physiology (Wilson, 1997, Visusal Neuroscience,
14,
403423)). This model assumes both
ON and OFF pathways with push-pull inhibition among them. This
model has all the elements of the merged models (and more) and
successfully predicts both the aperiodic and periodic phenomena
above.
Wilson, H. R. (1997). A neural model of foveal light adaptation and afterimage formation. Visual Neuroscience, 14, 403-423.
For very low (1 Hz) and very high (30 Hz) frequencies, this model does a satisfactory job at predicting probed-sinewave data when one assumes that the M-OFF pathway is twice as sensitive as the M-ON pathway (Hood and Graham, 1998). We are ignoring for the present the middle frequencies as the empirical results from various laboratories do not agree there.
The model also accounts for the dc-shifts as a function of temporal frequency (even at the middle frequencies). Incidentally, the dc-shift disappears if the push-pull (between On and Off channels) stage is removed from Wilson's model.
Another possible modification -- an explicit contrast gain control - is used to predict probed-sinewave results in a recent model by Snippe, Poot, and van Hateren (2000) to successfully predict all aspects of one set of results from probed-sinewave experiments.
Snippe, H. P., Poot, L., & van Hateren, J. H. (2000). A temporal model for early vision that explains detection thresholds for light pulses on flickering backgrounds. Visual Neuroscience, 17, 449462.
We have recently shown that probe threshold is elevated to its asymptotic level almost immediately (within 10-30 milliseconds - a fraction of a cycle) after the background starts flickering at 1.2 or 9.6 Hz (Wolfson and Graham, 2000, (abstract and some figures) and 2000). Thus all the features of the probe-vs.-threshold curve (including the dc shift) develop very rapidly. Wilson's model predicts this rapid adaptation correctly. We suspect that Snippe's model will as well.
Wilson's (1997) model does not predict correctly, however, at least two other results of probed-sinewave experiments: (1) The shape of the threshold-vs.-phase curve at middle frequencies (although different shapes have been measured by different investigators, as described in Graham and Wolfson (ARVO 2001) so any model will have at least to use different parameters for different studies); (2) More critically, perhaps, Wilson's model substantially underestimates the small but systematic difference between thresholds for incremental versus decremental probes such that the increment threshold is elevated more during the half-cycle when the background luminance is increasing (Wolfson and Graham, 2001). Incidentally, the existence of On- and Off-pathways in Wilson's model is not important for these predictions.
Further, Wilson's model's successful predictions depends critically on the push-pull mechanism. But the probed-sinewave results appear to be largely determined by retinal processes, and primate retinas are not thought to contain push-pull mechanisms.
Snippe, Poot, and van Hateren's (2000) model does predict correctly the shape of the curve at middle frequencies (for at least one set of data), and we also suspect it may predict correctly the increment/decrement difference (see Wolfson and Graham, 2001). And this model's successful predictions of probed-sinewave results depend on a contrast-gain mechanism, where contrast-gain mechanisms are known to occur in primate retinas.
Probed-sinewave experiments have proven to be a very powerful way to test models of retinal light adaptation. So far, in fact, no model has survived the test. The recent model by Snippe, Poot, and van Hateren (2000) seems promising to us, however.
None of the models above explicitly represent the quantal fluctuations (noise) in the light stimulus. Yet over the years a number of people have attributed a number of phenomena -- including those in light adaptation -- to these fluctuations. We went through a period in our modeling efforts where we were explicitly including probabilistic process representing this fluctuation. We rapidly discovered some properties of it, however, that convinced us we could leave it out of our models of light adaptation (Graham and Hood, 1992a)

With the ideal detector and without late noise, the observer's sensitivity as a function of mean luminance and temporal frequency is not affected by the filtering and gain-changing stage. (For intuition, see Graham and Hood, 1992a.)
Consequently if the early noise is entirely quantal fluctuations, sensitivity will always be a square-root function of mean luminance and a uniform (flat) function of temporal frequency. This latter prediction is contradicted by all known data.
Either the ideal-detector is the wrong decision rule or sensitivity is almost always limited by sources of noise other than quantal fluctuations.
With the peak-trough detector, however, with or without late noise, the observer's sensitivity as a function of temporal frequency does reflect the sensitivity of the low-level filtering and gain-changing stage. (For intuition, see Graham and Hood, 1992a) Late noise is needed, however, if the observer's sensitivity as a function of mean luminance is to go through both a square-root and a Weber region. Thus, if an observer other than an ideal observer is assumed, the usefulness of quantal noise in making predictions is much reduced. Of course quantal fluctuations exist as a source of noise in the visual stimulus, and we accept the ideal observer's usefulness as a benchmark for visual behavior. Over the course of evolution, quantal fluctuations presumably exerted some pressure - and quantal noise effects may still be more substantial at the lowest light levels in which humans function.
But incorporating quantal noise in models of light adaptation dynamics does not seem worth the extra machinery for our purposes.
There is an interesting difference between the spatial and temporal frequency dimensions with regard to these issues (Graham and Hood, 1992a). A model in which there are only quantal fluctuations, low-level visual processes, and an ideal observer (Fig. 2 in Banks, Geisler, and Bennett, 1987; Fig. 13 in Geisler, 1989) predicts a reasonably shaped high-spatial-frequency decline (unlike the flat uniform function predicted for temporal frequency by us). The question naturally arises: what did they do differently?
Banks, M.S., Geisler, W.S. & Bennett, P.J. (1987) The physical limits of grating visibility. Vision Research, 27, 1915-1924.
Geisler, W.S. (1989) Sequential ideal-observer analysis of visual discrimination. Psychological Review, 96, 267-314.
The answer is twofold. For one thing, the sinusoidal stimuli in their situation contain a constant number of cycles at all spatial frequencies rather than being of constant spatial extent. (Constant temporal extent was assumed in our statements about flicker.) This introduces a high-spatial-frequency decline in their predictions although it is not due to the spatial filtering itself.
Second, and unavoidably, the lower-level mechanisms in their approach (their deterministic filtering stage) includes optical blur.
Optical blur is intrinsically different from the temporal filtering in our model (and from spatial neural filtering as well). And there is no temporal analog to the optical blur.
Optical blur is NOT a spatial filter analogous to the neural temporal and spatial filtering for the following reason: Spatial (or temporal) filtering by the connections among neurons reduces the amount of each frequency in the quantal noise by exactly the same factor by which it reduces it in the signal. Optical blur attenuates the contrast of high spatial frequency gratings more than of low spatial-frequency gratings WITHOUT changing the amount of high- (or low-) spatial-frequency content in the quantal noise. For, after the light has gone through an optical lens, and been blurred, it is still ordinary light, and therefore it still has the Poisson-process quantal noise.
When studying visual processes, investigators have the problem diagramed below. They cannot possibly study all of the visual system at once, and so they hope or assume that it is sensible to "jump over" many processes not of direct concern to them by making very simple assumptions. For example, in my early research with near-threshold detection and identification experiments, I (along with scores of others) had hoped and assumed that all the nonlinearities known to occur in the retina (like light adaptation) could be ignored. In other words, our "Simple Rule 1" was very simple indeed: namely, that the input at each point in the receptive fields characterizing the multiple analyzers or channels was proportional to the luminance at the point in the stimulus. There was some justification for this Simple Rule 1 because we carefully kept the space-and-time-average mean luminance of the patterns constant and, since we were using patterns of near-threshold contrast, even the excursions from the mean were relatively constrained. "Simple Rule 2" was the decision stage assumptions.
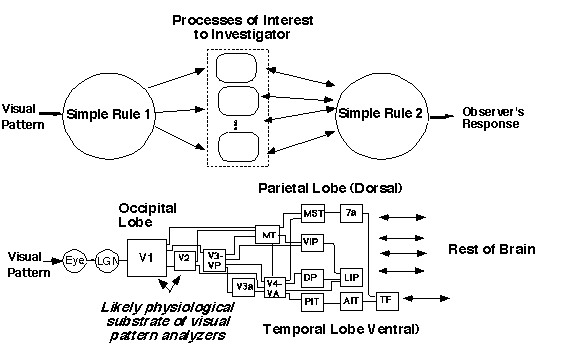
Useful and justifiable as these simple rules may be, one makes a mistake if one continues to use them without thinking. When the circumstances change, the simple rules may need to.
In our texture-segregation research, we became aware that light-adaptation processes might indeed intrude substantially and, therefore, we needed to consider them (e.g. Sutter, Beck, and Graham 1991). In fact, were light-adaptation compressive enough, it might underlie the compressiveness in the Constant-Difference-Series experiments. This led me to an interest in developing a model that would allow one to predict the light-adaptation processes' responses to our texture patterns. Of course, it didn't hurt that my colleague Donald Hood had been studying light adaptation for years. We started collaborating on models of light adaptation (particularly their dynamics, since texture segregation was thought to be "immediate" and one needed to know the transient responses of these processes). This work on light-adaptation models is described above on this page. To return to the original question about texture segregation:
The current status of Light Adaptation in explanations of our texture results:
As described on another page, however, we eventually have ruled out any local early (before-the-channels) explanation for this compressiveness in our texture segregation results. Thus light adaptation does not play the major role we thought at one time it might.
On the other hand, it seems likely that light adaptation processes occurring before the channels are the reason for the slightly greater effectiveness of decrements than of increments (of dark-square-element than of light-square-element element-arrangement textures, Sutter, Beck, and Graham, 1991; Graham and Sutter, 1996).
We are still looking for a model of light-adaptation dynamics good enough to use in modeling retinal processes while studying higher-level processes, although any of the current ones are better than nothing by quite a lot.