
Multiple analyzers are also known as "mechanisms", "channels", "filters", "pathways", etc. They analyze visual scenes into "parts" on many dimensions. One example is spatial-frequency (Fourier) channels, sometimes referred to as multiscale or multiresolution representations, where different channels are sensitive to different ranges of spatial frequency and orientation. (A pattern of narrow stripes or fine-grained texture contains predominantly high spatial frequencies. A pattern of large-sized elements contains predominantly low spatial frequencies. )
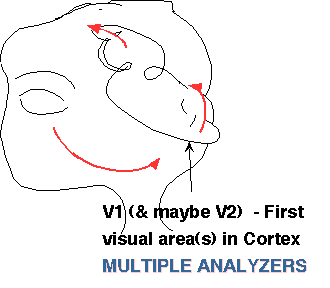
The physiological substrate is probably cortical area V1
- Example. Evidence from near-threshold summation experiments for spatial-frequency channels
- Spatiotemporal dimensions along which there might be analyzers
---Sinusoids, Gabor functions; Fourier analysis; Multiscale representations.-Near-threshold Detection and Identification Experiments
-Successful Model of Near-Threshold Experiments
---Multidimensional Signal-Detection Theory
---Probable Relationship to Brain
Graham, N. (1992) Breaking the visual stimulus into parts. Current Directions in Psychological Science, 1, 55-61. (Full text)
This article is a short summary of the Graham (1989a) book Visual Patterns Analyzers, which gives the arguments and evidence at much greater length. The article was meant to serve as an introduction to this topic for non-specialists and thus some might wish to read it first.
The left column in the figure below shows luminance profiles of four stimuli: two simple gratings each adjusted to be at observer's threshold (top two rows) and two compound gratings composed from the simple gratings but in different phases (bottom two rows). The frequencies of the simple gratings differ by a factor of three.
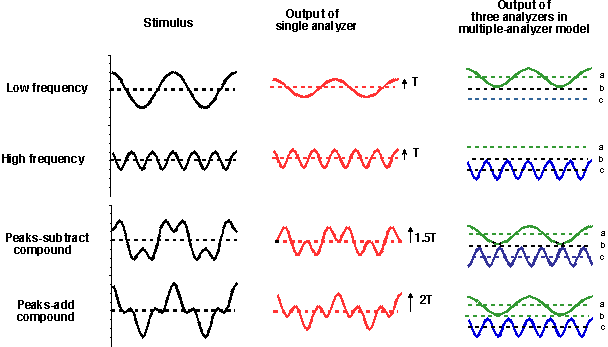
Middle column shows the predicted spatial output profiles (red) in response to those stimuli by a single-analyzer model. (The words analyzer and channel are synonymous in this section although I often use "analyzer" with a broader meaning.) According to this model, with any of a number of decision rules, the two compound gratings are both above threshold. Indeed, if the peak response determines threshold, the contrast in the peaks-subtract compound can be turned down by a factor of 1.5 and still be at threshold; the contrast in the peaks-add compound can be turned down even further (by a factor of 2.) before it reaches threshold.
For humans, however, both compounds are equally detectable and both are only slightly more detectable than the simple gratings (Graham and Nachmias, 1971; Graham, Robson, and Nachmias, 1978).
This human behavior is what is expected if there are separate channels sensitive to the two frequencies (as in the right column). Channel a (green responses) is sensitive to the low frequency. Channel c (blue responses) is sensitive to the high frequency. And channel b is one of the many channels sensitive to neither. Each of these channels only "sees" at most one of the components of the compounds. More rigorously, its response to the compound is identical to its response to one of the components. Hence, if the component is just at threshold for that channel, so is the compound. Notice that this model predicts a kind of phase-independence at threshold.
The reason why the compounds are slightly above threshold for human observers (even though their components are just at threshold) is probably that there are two channels responding to the compound and there is pooling of some kind across channels. This pooling may be "probability summation" (two channels each having an independent chance of seeing the compound is better than only having one channel with one chance), which would be the result of "noise" as in the successful model diagramed below. (With a simple equation to describe the distribution of this noise, the expressions for probability summation can be very simple, being power- or Minkowski- summation across different analyzers' sensitivities., e.g. Graham 1989a, Ch. 4.)
Many variations on single-channel models have also been considered and are unable to explain these experimental results from near-threshold summation experiments on the spatial-frequency dimension. Hence these results are generally taken as evidence for the existence of spatial-frequency channels in the human visual system.
An analyzer is an entity which is sensitive to a relatively restricted range of values along some dimension (e.g. sensitive to low spatial frequencies but not middle or high; or sensitive to vertical orientations but not to oblique or diagonal). I use the word analyzer in a rather general sense, so it might sometimes refer to a single neuron, for example, or sometimes to a group of neurons acting together.
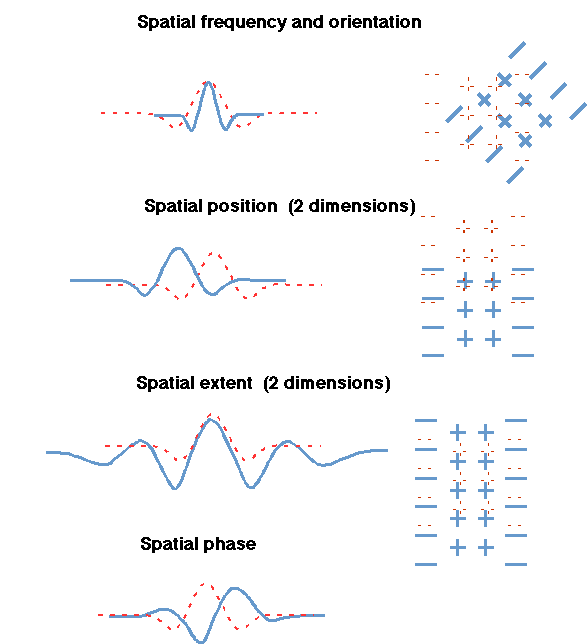
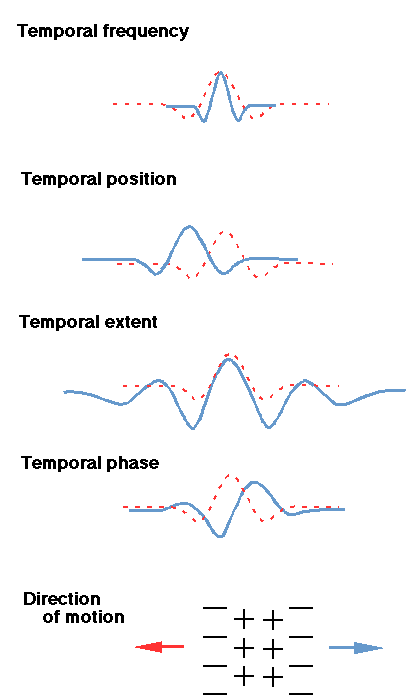
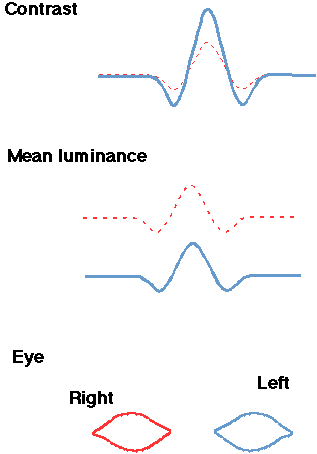
Below is a list (and figures) of spatiotemporal dimensions (illustrated with small figures) which have two related uses. One can classify certain simple visual patterns (windowed sinusoidal patches, or Gabor patches) along these dimensions, and these are also dimensions along which analyzers might exist in the human visual system.
The summary article (Full text ) gives more history and introduction to this topic of multiple analyzers and includes brief answers (in the summary table) to questions of whether multiple analyzers do exist along each dimension, and what their properties are. Chapter 12 of Graham, 1989a gives references to the many studies done by many investigators on each dimension.
| Spatial frequency & orientation (2 dim. spatial frequency) | Temporal frequency | Contrast |
| Spatial position (2 dims) | Temporal position | Mean luminance |
| Spatial extent (2 dims) | Temporal extent | Eye |
| Spatial phase | Temporal phase | |
| Direction of motion |
( for page with bigger versions of these figures)
 |
 |
 |
Sinusoids, Gabor functions; Fourier analysis; Multiscale representations.
The formalism of Fourier analysis has been useful in exploring this stage of visual processing. The stimuli often have sinusoidal luminance profiles or, as shown in the little diagrams in the figures, patches of sinusoids (windowed sinusoids, frequently "Gabor" functions). The receptive fields of the analyzers may also be well described by something like windowed sinusoids (Gabor functions or other "wavelets"). An introduction to this mathematics can be found in Ch. 2 of Graham (1989a).
When models are constructed containing analyzers on the spatial dimensions (i.e. on the two dimensions of spatial frequency -- spatial frequency and orientation -- as well as spatial position and spatial phase), they are often called multiresolution or multiscale image representations. (e.g. see Wandell, B., 1995, Foundations of Vision, Sinauer: Sunderland, MA.)
Evidence comes from a wide variety of experiments with near-threshold spatiotemporal patterns done in a wide variety of laboratories. The experiments can be classified into four kinds:
Pattern adaptation,
Summation
Uncertainty
Identification and discrimination.
These experiments and the logic involved in interpreting them are described in Graham (1989a) and briefly in the summary article Graham (1992) (to relevant section on these experiments) as well as many earlier publications. They have proven useful for revealing existence and properties of analyzers at a relatively low-level in visual processing. One example is given in the next subsection.
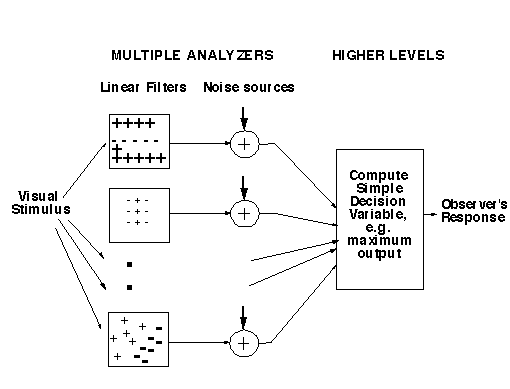
A rather simple model containing multiple linear filters plus noise plus a simple decision rule (see figure below) is probably sufficient to account for most phenomena with near-threshold* patterns. The decision rule in this model is an application of multi-dimensional signal detection theory since it requires integrating over many dimensions (the outputs of many analyzers).
This simple model seems to account for:
(*The detection threshold is the contrast at which the pattern is just discriminable from a blank stationary field of the same average luminance. A "near-threshold" spatiotemporal pattern is one that is imperfectly discriminable from a blank stationary field of same average luminance.)
Multidimensional Signal-Detection Theory
To make predictions from this successful model (and its alternates) for the summation, uncertainty, and discrimination & identification experiments is an application of multidimensional signal-detection theory. Our development of multidimensional signal detection theory is described in Chapters of the 1989 book (especially Ch. 4, 7, 8, 9, and 10) as well as in journal articles.
Probable Relationship to Brain
The likely brain substrate (in red below) for the multiple analyzers is area V1, the lowest visual area in cortex, and perhaps V2. This leaves a lot of visual cortex (in green below) to be modeled by the simple decision rule. It is as if near-threshold experiments made most of the visual brain transparent, allowing us to "see" the action of a relatively low level (the multiple analyzers). For more discussion see Graham 1989a and Graham 1992 (full text).