
EXPERIMENT 2
Potentiometric Titration of Coca-Cola and MicroLab Analysis of Vinegar
PART 1. Potentiometric Titration of Coca-Cola
Use the sodium hydroxide solution you previously prepared to potentiometrically titrate a sample of Cola as follows:
- 1. You should degas your soda by stirring under vacuum. Pour approximately 200 mL of your soda into a clean vacuum filter flask, add a stir bar, and stopper. Your mentor will demonstrate how to correctly use a vacuum system. Make sure your system has a trap and attach it to your flask. Turn on the water full-blast to create a vacuum and stir your soda vigorously on a stir-plate until you no longer observe bubbles. Why is it necessary to degas your sample before beginning the titration?
- 2. Rinse and full a burette with your standardized NaOH solution, and calibrate the pH meter with the buffer solutions provided. Why should you calibrate the pH-meter with a buffer solution?
- 3. Set up the potentiometric titration system (pH-meter and burette) and turn on the stirring to assure that the titrated solution is thoroughly mixed, being careful not to break the glass electrode with the magnetic bar.
- 4. Measure the initial pH and perform the titration recording the pH value every 0.50 mL of NaOH added.
PART 2: Titration of Vinegar using a Microlab
Vinegar is an incredibly versatile liquid. A preservative and condiment to the Babylonians, they began flavoring it with herbs. In its pure form it was a beverage to the Roman legionnaires. Cleopatra demonstrated she could consume a fortune in a single meal by dissolving pearls in vinegar to win a bet. Biblical references mention the use of vinegar for soothing and healing purposes. And even Hannibal when he crossed the Alps heated boulders and doused them with vinegar to crack crumble them from his path. In World War I, vinegar was used to treat wounds. And today it is recommended for treatment of rashes, bites and other minor ailments when camping. The frugal homemaker even recommends vinegar for uses such as laundry, metal polishing and insect repulsion.
Vinegar can be made from any fruit, or from any material containing sugar: apple juice being most commonly used. Vinegar is made by two distinct biochemical processes, both the result of the action of microorganisms. The first process is fermentation during which yeast converts sugars to alcohol. The second process converts the alcohol to acid using bacteria (“Acetobacter”). This is the acetic, or acid fermentation that forms vinegar.
This experiment will combine titration techniques we have learned previously with instrumentation and software called MicroLab. You will determine the concentration (V/V) of acetic acid in a commercial sample of vinegar.
Calibration of Drop Counter using Distilled Water
The drop counter on the MicroLab will be calibrated in order to know the volume of one drop of solution. The NaOH(aq) solution (which is standardized using KHP and an indicator) will be used to titrate a sample of commercial vinegar using the MicroLab system.
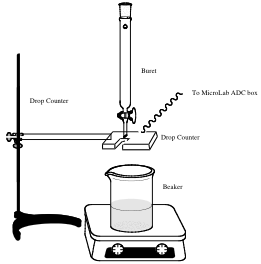
Set up the burette/syringe above a test beaker with the MicroLab interface between so the drops pass through the path of MicroLab sensor, which will count the drops. Follow the procedure given below (or in the help menu of the MicroLab software) to calibrate the drops from the burette.
- 1. Connect the MicroLab interface to the USB port of the computer and turn it on.
- 2. Turn on the computer and open the MicroLab software. (If software doesn’t open, make sure that the MicroLab interface is powered on and connected to the computer.)
- 3. When prompted to select an experiment type, select “Microlab Experiment” under the “New” tab. In the lower right corner, change the experiment name from “Untitled” to “Counter Calibration” and click OK. A new screen with multiple windows should open.
- 4. Connect the MicroLab drop counter to port A on the MicroLab interface. (The green light on the drop counter should light up.)
- 5. In the upper left window entitled “Data Sources/Variables,” click “Add Sensor.” A new window entitled “Choose sensor” should open. Where it says “<Choose sensor>,” select “Counter” and then select the input (port A) by clicking on the picture of the MicroLab interface; click “Next.”
- 6. Select “Continually increasing count” and click “Finish.” This should close the window and return you to the previous screen, and “Counter” should be added to the list of sensors in the upper left corner.
- 7. Click and drag “Counter” from the upper left window into the lower right window where it says “Digital Display.” This window should now read “Counter = 0.00.”
- 8. Set up a 10 mL syringe and the drop counter so that liquid will flow through from the syringe, through the sensor on the drop counter, and into a clean beaker as shown. Make sure that the stopcock on the syringe is in the closed position (horizontal). Fill the syringe with about 10 mL of the liquid to be distilled.
- 9. Slowly turn the stopcock toward the open position until drops of liquid begin to flow from the syringe. Adjust the stopcock until the drops flow at a rate of about 1 drop a second. You should notice the red light on the drop counter blink every time a drop passes through the sensor. You may need to adjust the position of the drop counter in order for the sensor to detect each drop. You should put the counter as close to the syringe as possible without allowing the sensor to get wet.
- 10. Once you have the set up adjusted, close the stopcock and refill the syringe to exactly 10 mL. (You can use the liquid that you collected in the beaker during the previous step.) You are now ready to begin the calibration experiment.
- 11. First, go back to the MicroLab program and click the “Start” button on the left. The counter display on the right should now be in boldface. Now slowly turn the stopcock toward the open position until you can get the drops to flow at a rate of about 1 drop a second. The counter display should increase for each drop. (Don’t worry if the counter is going up in multiples of 2 or more; the refractive power of different liquids can cause individual drops to be read as multiples of itself. Our calibration will compensate for this.)
- 12. Keep dispensing liquid until the volume in the stopcock reaches 5 mL. At this precise point, click the “Stop” button (located next to the “Start” button) to stop the counter. You should now have a value for the number of drops there are in 5 mL of solution.
- 13. To calculate the volume of each drop, divide the volume dispensed by the total number of drops counted (use the value given by the drop counter). For example, if the drop counter finished at 300, you would have the following equation:
Volume of a drop = 5 mL / 300 drops = 0.0167 ml/drop - 14. You can use this value to convert the drops counted by the drop counter during the titration. Click on “Add Formula” in the “Data Sources/Variables” window and input a formula that will convert a drop count to volume based on your calibration. Drag this formula from the “Data Sources/Variables” pane to the X-axis of the graph on the right.
Calibration of pH Meter
- 1. Click on “Add Sensor” and choose “pH meter.” Clicking “Next” will bring you to a calibration screen. Select “Perform New Calibration.”
- 2. Click “Add New Calibration Point” and immerse the electrode in the provided pH 4 buffer. A calibration window will appear with a “Rate of Change” and “Sensor History” graph. The “Rate of Change” graph will have a vertical bar whose position fluctuates about a central position. When its position becomes constant (or fluctuates only slightly within the green zone of the graph), enter the pH of the buffer in the “Actual Value” box and click “OK.”
- 3. Add a calibration point for the pH 7 buffer as above. Then select “First Order (linear) fit” from the left panel of the calibration window. Click “Accept and Save this Calibration.”
- 4. Drag the pH sensor from the “Data Sources/Variables” pane to the Y-axis of the graph on the right.
Titration of Vinegar
Use the standardized NaOH solution prepared above to titrate 1 mL of the commercial vinegar sample provided to the group using a MicroLab. Dilute the sample of vinegar using water. Titrate the solution drop by drop (using the drop counter) the titration is complete at about pH 12.
RESULTS
Potentiometric Titration
Volume of Coca-Cola titrated ______+_____g
Initial pH ______+_____pH units
During the course of the potentiometric titration, you should record the pH after every addition of 0.5 mL NaOH. Tabulate your data as follows:
Buret reading (mL)
|
pH
|
∆pH
|
Vol. NaOH Used (mL)
|
∆Vol. NaOH Used (mL)
|
∆pH/∆Vol. NaOH Used
|
Input these data into an Excel worksheet. Perform the following operations on the worksheet using formula: calculate the values of volume of NaOH added (∆vol), change in pH (∆pH), and change in pH per volume of base added (∆pH/∆vol. NaOH added). You will use these values to plot pH (y-axis) versus volume NaOH added (x-axis) and ∆pH/∆vol base added (y-axis) versus volume NaOH added (x-axis). Predict the shape of the latter graph based on your first graph and your knowledge of Calculus. How would you name these graphs?
Look at the ingredients of Coca-Cola. What acid do you suppose you’re observing? Do your plots support your conclusion? From the ∆pH/∆vol vs. volume of base plot determine the equivalence point(s) and the amount of base added to reach them. Use these values to determine the concentration of acid in your soda. Next, find the half-equivalence point(s) and determine the dissociation constants, Ka. On this same graph label the equivalence point and the half-equivalence point(s) where the Ka value(s) were found.
Titration of Vinegar
Determine the concentration of your vinegar and find the half-equivalence point and Ka as you did for your soda. Assuming the density of commercial vinegar is close to that of water (1.00 g/mL), calculate the percent (by mass) of acetic acid in vinegar.
DISCUSSION
- •In your own words, define primary and non-primary standards.
- •What would be the effect of using a more concentrated solution of NaOH in the titrations? How would this affect the titration curves and the ∆pH/∆vol vs. volume base graphs?
REFERENCES
Fine, L.W., Beall, H. and Stuehr, J. Chemistry for Scientists and Engineers (Preliminary paperback version of the new Second Edition). Philadelphia: Saunders College Publishing, 1999. Chapter 11.
Kotz, J.C. and Treichel, P. Jr. Chemistry & Chemical Reactivity (Fourth Edition). Fort Worth: Saunders College Publishing, 1999. Chapters 17 and 18.
Oxtoby, D.W., Freeman, W. and Block, T. Chemistry Science of Change (Third Edition). Philadelphia: Saunders College Publishing, 1998. Chapter 8.