EXPERIMENT 8
Chromatography
Chromatography
INTRODUCTION
Separation of a mixture into its pure components is an essential part of organic chemistry. For example, a chemist may want to purify the crude extract of a medicinal plant, isolate the pure product(s) of a chemical reaction from the reaction mixture, or identify foreign compounds in a sample. You may have noticed that the standard operating procedures in this course covered basic separation and purification techniques: recrystallization, distillation, and extraction. This experiment will add a fourth: chromatography.
BACKGROUND
All of these techniques are similar insofar as they take advantage of differences in physical properties between various compounds. Recrystallization and extraction take advantage of the fact that compounds may have different solubilities in a particular solvent. Distillation uses variations in boiling points between liquids. As you will see, chromatography will primarily use a different property, polarity, to separate a mixture.
Chromatography is one of the most ubiquitous methods of analyzing and purifying organic compounds. Flash column chromatography (occasionally CC) separates large quantities of compounds under air pressure while thin layer chromatography (usually referred to as TLC) is more useful for qualitative analysis and small-scale separations. Gas chromatography (usually called GC) is purely an analytic technique.
The fundamental principle of chromatography is the distribution equilibrium that forms when a compound is either dissolved in a mobile phase or adsorbed on a stationary phase.

When a compound is dissolved in the mobile phase it is carried along the direction of flow, but when it is adsorbed, or stuck, on the stationary phase it does not move. If compound B spends more time in the mobile phase than compound A, B will move further along the column than A. The longer the mobile phase travels, the better the separation between A and B.
Stationary phases are usually very polar, while mobile phases vary widely in polarity, but are less polar than the stationary phase. This is called normal phase (NP) chromatography. The exception is reverse phase (RP) chromatography, in which a polar mobile phase, and a less polar stationary phase are used.
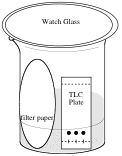
In normal phase chromatography, where the stationary phase is polar, polar molecules will spend more time adsorbed on the stationary phase, while less polar ones will be carried more quickly by the non-polar mobile phase. In the diagram below, assuming that the setup is normal phase, B represents a less polar compound, while A represents a more polar one.

1. Thin Layer Chromatography
This technique is performed on a glass or plastic plate that is coated with a thin layer (thus the name) of dry adsorbent. Usually these plates are pre-coated with a layer of silica gel or alumina. These are inorganic materials and are very polar compared to nearly all organic structures. The sample mixture is spotted on the plate near the bottom, and the plate is put in a closed beaker or jar with a small amount of the appropriate solvent or solvent mixture.
Capillary action draws the solvent up the plate. When the solvent front is near the top, the plate is removed from the beaker and a separation of the sample's components may be observed.
Visualizing the TLC Plate
If the compounds are colored, the plate can be read easily. If the compounds are not colored then they can be visualized using an ultraviolet lamp or a chemical stain. There are a wide variety of chemical stains based on the functional groups present. The following methods of detection will be used in this laboratory:
Ultraviolet Light Detection: A nondestructive visualization technique that will show any compounds that absorb UV light. Compounds containing benzene rings or conjugated systems usually absorb UV light. Commercial TLC plates have phosphor in the adsorbent, which fluoresces in short-wave UV light. If a compound is present on the plate it blocks the glow and appears as a dark spot. (This is technically true only for compounds that quench the fluorescence). Some organic compounds also fluoresce themselves, and will show up as bright spots under short-wave UV light.
Iodine vapor: Iodine vapor is also a non-destructive visualization technique. A few crystals of iodine are placed in a closed chamber, such as a capped jar containing silica gel, and the slide is placed into the chamber to collect on the spots by a weak electronic attraction. Iodine forms a yellow or brown complex with most organic compounds containing double bonds, even isolated ones. The reaction is reversible, so that I2 staining can be followed by another chemical stain if the plate is allowed to sit in air for several minutes so that the iodine can sublime off the plate.
Please note that while these two methods will show any compounds containing double bonds, any compounds without double bonds will not show up on your plate (unless they are themselves colored, in which case you will be able to see them with your naked eye). Other TLC visualization methods exist for these compounds, but they are usually strong oxidizers and for that reason not safe for use in an undergraduate lab.
Rf Values
For each spot on the TLC plate, a characteristic value Rf (ratio to the front) can be calculated. Rf is defined as the ratio of the distance traveled by a spot (measured from the center of the spot) to the distance traveled by the solvent (See Figure below)

Although the Rf is characteristic for a given compound, it depends greatly on the solvent and the type of adsorbent used. Consequently, the CRC Handbook of Chemistry and Physics and Merck Index do not contain tables of Rf values. The difference in Rf values between two spots on a plate, ∆Rf, which also varies with the solvent, is used as a measure of the performance of the separation. The bigger the difference, the better the separation.
Note that all Rf’s are measured from the baseline (the line on which the spots were placed), and not the bottom of the plate, and measured to the solvent front, not the end of the plate.
The choice of solvent system is crucial for good separation. If the developing solvent has a high polarity, all of the spots will run to the top of the plate, and ∆Rf will be zero. With a very non-polar solvent, the spots will not move at all from their initial positions, and again ∆Rf = 0. The best separation is often achieved by using a mixture of a non-polar solvent with a polar solvent. The polarity of the developing solvent is adjusted by changing the ratio of polar to non-polar solvents in the mixture. The best developing solvent should give an Rf value of 0.3 to 0.7 for the desired compound and a ∆Rf of at least 0.1 between the desired compound and any impurities.
Because the fundamental action of chromatographic separation remains the same, an appropriate solvent mixture is often determined via TLC and then used to run a column in column chromatography.
2. Column Chromatography
This technique is performed by packing a glass tube with an adsorbent as shown in the figure below. There are many different types of adsorbents (solid phase) that are used in column chromatography, and the choice of adsorbent depends on the types of compounds to be separated. The most common adsorbents used are silica gel and alumina. Silica gel is used to separate a wide variety of compounds such as hydrocarbons, alcohols, ketones, esters, acids, azo compounds, and amines. Alumina is also used extensively, and comes in three forms: acidic,
basic, and neutral. Acidic alumina is used for separating acidic materials such as carboxylic acids and amino acids. Basic alumina is used to separate amines, while neutral alumina can be used to separate non acidic and non basic compounds. Likewise, cellulose, starch and sugars are used to separate natural products, and magnesium silicate is used in the separation of acetylated sugars, steroids and essential oils.

In the diagram above, cotton is added to prevent the sand and silica from running out the bottom. The sand is added on top to create a level surface for the silica to rest on. Next, the silica is added, followed by another layer of sand. This layer of sand protects the silica underneath from being jostled by the addition of sample and solvent later on.
It is important to keep silica and all adsorbents both level and moist while running a column. You want your adsorbent to be as uniform as possible all the way around. If the surface is not level, compounds traveling down one side of the adsorbent will get through faster than those traveling down the other side, which can lead to overlapping bands (think of the side with less silica as giving its compounds an unfair head start, which might allow slower-moving, more polar components to travel as fast as faster-moving, less polar components traveling down the other side). Letting the column go dry will create cracks in the adsorbent, which act as similar shortcuts.
A column may be packed either 'wet' by pouring a solvent-adsorbent slurry into the tube or 'dry' by filling it with dry adsorbent. If it is packed dry, it must still be kept wet once solvent has been added. The mixture to be purified is then dissolved in a small amount of the appropriate solvent and added carefully to the top of the solid adsorbent. It is added carefully to ensure that the packing is not disturbed. The column is developed by adding more solvent to the top, then collecting the fractions of eluent (the compound-containing solution) that come out the bottom. For 'flash' column chromatography, moderate air pressure is used to push the solvent through the column. The success of the separation and the contents of the fractions can be determined by spotting the fractions along with the initial mixture on TLC.
A column may be developed with a single solvent or a solvent gradient (a solvent system which gradually increases in polarity.) For example, a column may be developed first with a low polarity solvent such as hexane, and as fractions are collected the developing solvent is changed to 10:1, 5:1, and 1:1 hexane-methylene chloride. A polarity gradient is used for mixtures of compounds with very different polarities.
Solvents: A common non-polar solvent for both thin-layer and chromatography is hexane. It can be used with a variety of polar solvents. The following solvents are listed in approximate order of increasing polarity: cyclohexane, petroleum ether, pentane, carbon tetrachloride, benzene, toluene, chloroform, ethyl ether, ethyl acetate, ethanol, acetone, acetic acid, and methanol. The higher the percentage of polar solvent, the faster compounds will elute.
Elution sequence: An approximate elution sequence, based broadly on polarity, for compounds from fastest to the slowest is hydrocarbons, olefins, ethers, halocarbons, aromatics, ketones, aldehydes, esters, alcohols, amines and acids.
Note that the more polar the solvent, the faster compounds elute, regardless of the compounds polarity. This means changing the solvent polarity cannot change the order compounds elute from a TLC or column. This may seem non intuitive, as it would seem that a polar solvent would move a polar compound farther than a nonpolar compound.
To help visualize this concept, consider that solvents will compete with compounds for sites on the stationary phase. A less polar solvent will not compete well, allowing the compounds to remain bound to the stationary phase, resulting in slow elution. A polar solvent will compete well with molecules and will occupy sites on the stationary phase. This will force compounds into the mobile phase, and result in faster elution/increased travel distance.
It may also be helpful to remember that alumina and silica are much more polar than any organic solvent. Therefore, the stationary phase will always be more polar than the mobile.
3. Gas Chromatography
As in other types of chromatography, the analytes exist in equilibrium between the stationary and mobile phases. The analytes can be 'stuck' on the adsorbent as a liquid, or moving with the carrier gas as a vapor.
GC is somewhat different from the other two methods explored in this experiment in that here the boiling point is the primary property on which the separation depends. However, you will see that if two compounds have similar boiling points but very different polarities, they can be separated by polarity via GC.
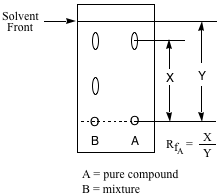
The gas chromatograph contains a long (6 ft. or longer) stainless steel tube packed with adsorbent (usually a liquid phase on an inert solid support) and put in a temperature controlled
oven. The solid phase used in the 8400 Perkin-Elmer Gas Chromatograph is carbowax, a carbon backbone polymer OH-(CH2-CH2-O-)n-H, on silica. This is non-polar like thin layer chromatography and column chromatography. An inert gas, helium in our lab, is passed through the column at a controlled flow rate and serves as the mobile phase. A small amount (about one microliter) of a liquid sample is injected into the tube, and compounds are detected as they emerge from the outlet.
The detector response is plotted vs. time, and this is called a chromatogram. The time it takes an analyte to emerge from the column is called the retention time, RT, and is analogous to Rf for TLC. The detector response is proportional to the amount of compound passing through it, so the area under a peak is roughly proportional to the total amount of compound in the sample. Hence, the ratio of areas in a single chromatogram is approximately equal to the ratio of compounds in the mixture. In the old days these areas were measured by cutting out and weighing the paper for each peak! Our GCs are computer controlled and automatically calculate the retention time and area for each peak.
Basic Theory
It is easiest to imagine a GC as a miniature distillation. A small amount of a mixture of liquids is injected into one end of a long capillary tube. They all heat at the same rate, until the temperature rises to the boiling point of the lowest-boiling liquid in the mixture. It becomes a vapor and is carried along by the helium carrier gas towards the detector. As it travels, the second-lowest-boiling component may boil and begin traveling down the column as well, behind the first fraction. When the first component reaches the detector, a peak is recorded. If the separation was good, there should be as many peaks as components in the mixture.
Because the column is polar, components will not travel straight through but will be slowed down more or less based on their own polarity. More polar compounds will adsorb on the stationary phase and travel more slowly, leading to longer retention times. However, this effect is generally minor. So long as your liquids have boiling points that differ by ten degrees or so or more, you are likely to see your components come out in order of boiling point. If, however, you have liquids that boil within a few degrees of one another, polarity may come into play.
Temperature
Rather than choosing a solvent as is done for TLC and column chromatography, one chooses an oven temperature for GC. The oven temperature is analogous to the polarity of the
solvent in TLC. A high temperature leads to short RT and little separation because all compounds are vaporized and they move at the same rate as the mobile phase. A very low temperature leads to long or nearly infinite RT since the compounds remain adsorbed on the solid phase. In addition, diffusion causes the peaks to spread out as the RT increases, so compounds that are retained in the column for a long time give broad, ill-defined peaks.
The temperature of the injection port and detector are controlled separately from the oven temperature. The injection port must be hotter than the oven to insure that the entire sample goes into the column rather than condensing in the injector. The temperature of the detector is also set higher than that of the column so that compounds do not condense in it.
Gas Flow
The carrier gas flow rate is set for optimum column performance but is not regularly adjusted. A fast flow rate leads to short retention times but can give poor resolution. A slow flow rate gives long retention times and broad peaks. To obtain a good compromise between high separation efficiency and quick chromatographic separations it is usually better to use a high flow rate (20-30 mL/min) and a low temperature.
Columns
There are two kinds of columns: wide bore and capillary. A wide bore column is usually 1/4"-1/8" diameter stainless steel and is packed with adsorbent. A capillary column has a much narrower diameter and the adsorbent is coated on the inside surface. Capillary columns give much better resolution but they have much lower capacity. These columns require a splitter, which allows only a fraction (1/50) of the injected sample into the column. Long columns always give better separation than short columns.
Detectors
There are two common types of detectors: thermal conductivity (TCD) and flame ionization (FID).
For TCD a hot filament is placed at the column exit port. Helium cools the filament as it flows over it, but when the helium is diluted with an organic compound, the filament is cooled differently and the conductivity changes. A Wheatstone bridge, an electronic device that senses the conductivity difference between two filaments, measures the actual response. A reference filament is attached to a second column in the same oven. The reference column is structurally the same as the sample column but it is never used for the sample. Pure helium is the only gas flowing through. It provides the baseline of the chromatograph. Injecting sample into the reference column will result in 'negative' peaks or no peaks depending on the system.
Flame ionization detection is done by burning the sample in a flame and measuring the ions produced. It does not require a reference column. FID is used with capillary columns, where the low flow of helium makes it impractical to use TCD.
4. High Performance Liquid Chromatography (HPLC)
The technique is based on the same principles as GC (i.e. partitioning between phases, the main difference is that the analyte is pumped by the mobile phase through the column instead of being pushed by the carrier gas in GC. HPLC is applicable to over 80% of all known compounds and is the method of choice over gas chromatography (GC) for the separation of nonvolatile and thermally unstable compounds.
In an HPLC system, a pump shoots the mobile phase through the system at the desired flow rate (Figure. 1). At the injector, the user inserts the sample for analysis. The injector is usually found right before the column. From there, the mobile phase picks up the sample and carries it through the column where it is separated into its various components. The separated components then travel through a detector cell where, based on the individual components' properties like UV absorption, fluorescence, or electrical conductivity, the amount of each component is determined. A recorder or another data-handling device translates the detector's electrical signals into peaks of various sizes. The most popular mode of HPLC is reversed-phase chromatography (RP-HPLC). In this technique, the stationary phase is non-polar (e.g. carbon chain bonded to silica) and the mobile phase is polar (e.g. methanol, water, acetic acid).
This is opposite to normal phase HPLC where the stationary phase is polar (e.g. silica, alumina) and the mobile phase is non-polar (e.g. hexane). The length of the carbon chain of the stationary phase used in RP-HPLC is typically eight (C8) or eighteen carbons (C18). The separation is based on partitioning of the sample components between the mobile and stationary phases.
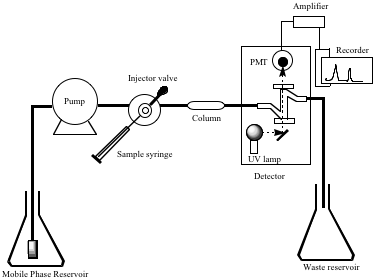
Figure 3. Schematic diagram of an HPLC System
HPLC Operating Parameters
In this experiment you will be able to modify all the following parameters with the exception of the column packing.
- 1. Pump parameters:
- a) Mobile phase composition
- b) Flow rate
- 2. Column parameters:
- a. Stationary phase (packing) reversed-phase vs. normal-phase
- b. Mobile phase composition
- 3. Injector volume
- 4. Detector parameters:
- a. Detector wavelength
- b. Attenuation (AUFS, Absorbance Units Full Scale)
- c. Pump flow rate
EXPERIMENTAL OUTLINE
You will determine the composition of a mixture of ethanol and cyclohexanol using GC, and of caffeine and acetaminophen using HPLC.
PROCEDURE
PART 1. Gas Chromatography
The composition of an unknown mixture of ethanol and cyclohexanol will be determined using GC. The mixture will be separated and the peaks obtained on the chromatogram identified by determining the retention times of pure ethanol and cyclohexanol. The experiment will be performed using a Thermal conductivity detector (TCD) Gas Chromatograph. Your TA will give you guidelines for operating this instrument. One important thing to remember is that the injector port on a GC is hot. It is usually 50 degrees or so hotter than the oven, which may itself be 200 oC or more. The injector port is exposed on the top--be careful not to burn yourself!
You will choose the GC sequence titled “HSSP07” and note the parameters this sequence uses. The mixture will be injected and the parameters varied to effect a separation if necessary.
In general assume that all syringes are dirty. You should first rinse out each syringe with the sample you plan to inject two or three times to make sure there is no residue left from the last sample injected. You will be loading the syringe with 1 micro liter injections of your sample.
Once the peaks are separated you will inject pure components to identify your peaks.
PART 2. High Performance Liquid Chromatography (HPLC)
HPLC will be used to analyze a mixture of acetaminophen and caffeine. The effect of parameters on the separation of peaks in the chromatogram will be investigated and an optimal separation obtained. Pure components will be used to identify the peaks in the mixture. A calibration curve will then be created to determine the concentration of acetaminophen in the mixture.
Sample Mixture Preparation
- 1. Fit a plastic filtering syringe. Remove the cap on the tip, fit the bottom of the syringe with a filter, and pull out the piston.
- 2. Pour about 0.75 mL of caffeine and 0.25 mL acetaminophen into the top of the syringe. This solution will be used for parameter investigation as well as preparation of a calibration curve.
- 3. Place the syringe over an open, clean glass vial and filter the liquid into the vial by pushing the piston back into the syringe shaft.
- 4. Repeat the above steps for solutions of the following composition for the calibration curve:
0.10 mL acetaminophen, 0.90 mL of caffeine
0.50 mL acetaminophen, 0.50 mL of caffeine
0.75 mL acetaminophen, 0.25 mL of caffeine
Instrumental Parameter Investigation
- 1. Following your mentor’s demonstration with regard to the proper handling of the Hamilton syringe, perform an initial trial with the following suggested settings:
flow rate: 1.2 mL/min %methanol = 30%
chart speed: 30 mm/min, AUFS (attenuation) : 1.
Be sure to inject more than 20μL of the sample as this instrument has a 20μL sample loop. - 2. Examine the number of peaks, peak quality (are the peaks overlapping or are they separate, “resolved?”) , and baseline quality (is the baseline straight? Does it drift up or down?)
- 3. Label the chromatogram with the set of parameters used. Investigate the effect of varying flow rate, chart speed, AUFS and %methanol on the quality of separation. Be sure to record the settings on the chart and change each parameter back to the initial setting before using a new set of parameters.
Separation Optimization
Using your knowledge of how instrumental parameters affect the appearance of a chromatogram, experiment with different settings to achieve the best resolution of the components in the mixture. Remember to record the parameters that provide the optimal separation. Record the column length in your notebook.
Peak Identification
Under the conditions used for optimization, inject filtered samples of the pure components to identify the peaks on the chromatogram. Be sure to rinse the syringe with the incoming mixture to remove all traces of the previous mixture
Peak Calibration
Using the optimized conditions, inject the four different acetominophen-caffeine mixtures you prepared (three times each so you can average the data obtained) . Be sure to rinse the syringe with the incoming mixture to remove all traces of the previous mixture
Unknown Determination
Inject the unknown sample into the HPLC using the same conditions as for the peak calibration.
Peak measurement
Measure the peak height (h) and peak width (Wl ) for each of the peaks in the calibration as well as the unknown. Then use these to calculate peak are using the approximation to a triangle 1/2 x Wl x h. You should average the same injections to that your final data involves 4 points (from the calibration) and 1 point from the unknown. Now plot a calibration curve for area vs. concentration, obtain the equation of the fit, and determine the concentration of the unknown.