EXPERIMENT 7
IR Spectroscopy
IR Spectroscopy
BACKGROUND
What is unique to chemistry is the molecule and the chemical bond. All molecules are made up of atoms held together by chemical bonds. These atoms vibrate with respect to each other with the bonds acting much like vibrating springs connecting them. Each molecule has a characteristic set of vibrational frequencies in the same range as the infrared frequencies of electromagnetic radiation. Infrared is the portion of electromagnetic radiation that extends beyond the visible into the microwave region. It is divided as follows:
-Near infrared (NIR) or overtone region from the visible region to 4000 cm-1.
-Mid infrared, or fundamental region from 4000 to 400 cm-1. This is the segment of the infrared most often used by organic chemists.
-Far infrared (FIR) is the low frequency region, which ranges from 600 - to 10 cm-1.
Infrared spectral analysis gives the scientist a permanent, step-by-step record of his or her work. In carrying out a complex synthesis, for example, one can determine the identity and purity of reactants, follow changes taking place during conversion to products, determine yields and product purity. Furthermore, there is never any fear of having insufficient sample to proceed to the next stage of a synthesis or process since infrared analyses are nondestructive. The analytical sample is fully recoverable and reusable. Engineering processes such as distillation, oxidation and polymerization can be monitored on-line by direct sampling. In the near infrared (NIR) region, fiber optics are used to conduct radiation to and from sample and spectrometer.
Types of Vibrations
If infrared radiation of a given frequency strikes a sample composed of molecules having a vibrational frequency the same as that of the incident radiation, the molecules absorb radiation and the energy of the molecule is increased. However, if the incident frequency differs from the characteristic frequencies of the molecule, the radiation passes through undiminished, or in some experiments, it is reflected. The vibrational frequencies for a particular molecule are determined primarily by the masses of the atoms in the molecule and the strengths of the bonds connecting them. For a diatomic molecule, this frequency can be derived from Hooke's law and is written as:

Where is the frequency of vibration; k is the bond force constant (dyne/cm) and µ is the reduced mass of the atoms in the bond:
is the frequency of vibration; k is the bond force constant (dyne/cm) and µ is the reduced mass of the atoms in the bond:
Furthermore, the proximity and spatial geometry of various groups of atoms often influence vibrational frequencies. Collectively, these characteristic vibrational frequencies "fingerprint" molecules, uniquely distinguishing them. The IR spectrum of a chemical compound can be considered as an inherent physical property.
The most useful vibrational frequencies are the fundamental vibrations, those that occur when molecules absorb infrared radiation that promotes them to the first vibrationally excited state. On excitation to the second or third excited states (or beyond), the overtone vibrational frequencies are observed. That is true for the frequencies of all mechanical oscillators. Coupling of fundamental vibrations produces new vibrations at frequencies above and below those observed in the absence of coupling. Fermi resonance, due to interactions between fundamental vibrations and overtones, is not uncommon in the infrared. This effect was first described for the vibrational spectrum of CO2.
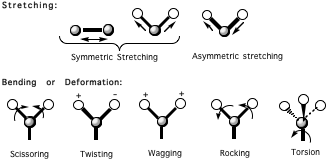
Figure 1
Molecular vibrations are also classified according to whether the vibrations are associated with stretching, bending or torsional motions. Stretching motions can be symmetric or asymmetric. Bending motions are sometimes called deformations and are sub classified as scissoring, twisting, wagging, and rocking motions. Stretching and bending frequencies are dependent upon the masses of the vibrating atoms (or groups of atoms) and the stiffness of the spring-like chemical bonds connecting them (Fig. 1).
Stretching vibrations always have higher frequencies than bending vibrations of the same group (it's easier to bend a molecule than to strecht it). The smaller the masses of the atoms, the greater the vibrational frequencies. Likewise, the stiffer the bonds, the higher the frequencies. A bond's stiffness as measured by its force constant, is proportional to bond strength, which in turn is proportional to the bond order. That is, for groups with atoms of the same mass, a triple-bonded group has a higher vibrational frequency than a double-bonded group, and the double-bonded group has a higher vibrational frequency than a single-bonded group. A group bonded with a single bond that has partial double-bond characteristics, such as often results from resonance, has an intermediate vibrational frequency between those of the same group with "pure" double and single bonds.
Vibrations of groups where one atomic nucleus is a proton have the highest frequencies of all molecular vibrations. All stretching vibrations of hydrogen atoms occur above 2250 cm-1. No other groups have fundamental absorptions in this region although overtones from lower frequency vibrations are sometimes observed above 2400 cm-1.
Groups with triple bonds absorb in the next highest region of the spectrum, from 2300 to 2100 cm-1. The only other principal group to have fundamental absorptions in this region are those with cumulated double bonds (2350 - 1930 cm-1) such as ketene, H2C=C=0. Cumulated double bonds absorb at higher frequencies than other double bonds (1900 - 1580 cm-1) due to coupling between the bonds. Coupling, or mechanical interaction, occurs when two groups having similar frequencies are close to each other in the same molecule. In effect, resonance is established between the two vibrating groups, and vibrational energy flows back and forth between them so that the vibrations of the two groups modify each other. Another way of viewing this is that the coupling groups lose their individuality and vibrate together. Coupling is strongest when the two interacting groups share a common atom and the frequencies of the two groups are very close. Carbon dioxide is such a molecule. The stretching frequencies of most carbonyl groups are somewhere near 1700 cm-1. In carbon dioxide the two carbonyl groups vibrate together with the asymmetric stretching vibration occurring at about 2350 cm-1 and the symmetric bending vibration occurring at approximately 1330 cm-1. The symmetrical stretching vibration is actually a complex, widely spaced doublet due to Fermi resonance between an overtone and a bending vibration. The symmetrical stretching vibration itself does not cause an infrared absorption because no change in dipole moment occurs.
Selection Rules
If a pair or group of atoms is to absorb infrared radiation, it must undergo a change in dipole moment during the vibration. The changing dipole moment couples the vibration of the molecule with that of the radiation in much the same way as air couples the motion of a moving fan with another that is close by. IR inactive vibrational frequencies occur when the molecule contains a center of symmetry, which is retained upon vibration. The stretching of the carbon-carbon double bond in ethylene does not absorb infrared radiation because there is no change in dipole moment during the vibration.

The stretching of the carbon-carbon double bond in chloroethylene causes a significant change in dipole moment, and this double bond has a strong infrared absorption. The changing dipole moment couples the electromagnetic radiation with the vibrating carbon atoms.
Qualitative Analysis
Infrared spectrometers measure the vibrational spectrum of a sample by passing infrared radiation through it and recording which wavelengths have been absorbed and to what extent. Since the amount of energy absorbed is a function of the number of molecules present, such instruments provide both qualitative and quantitative information. The recorded spectrum is a plot of percent transmittance (or absorbance) versus wavenumber or wavelength of the radiation. Since the spectrum is a fundamental property of the molecule, it can be used both to qualitatively characterize the sample and to quantitatively determine concentration. The fingerprint provided by the infrared spectrum contains basic information about the composition and structure of a compound. Organic compounds contain functional groups such as -OH, -NH2, -CH3, -CO, -CN, -C-O-C-, -COOH, -CS, etc.... each of which has characteristic absorption frequencies in the infrared that are usually relatively unaffected by the remainder of the molecule. When they are affected by the rest of the molecule, additional information about its structure can be obtained. The regions and the spectral correlations for some representative vibrations are summarized in Fig. 2. Consequently, an unknown compound can often be characterized by observing the presence of the absorption frequencies associated with such groups.
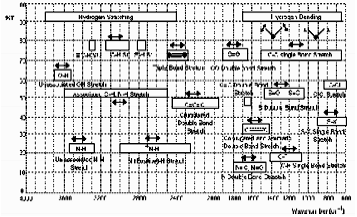
Absorption of different regions of the Mid IR spectrum
Spectral correlation charts of characteristic absorption bands for most of the common functional groups make it possible to determine the gross structural features of an unknown by band identification. Commercial instruments contain large data files with more than 150,000 spectra, which may be searched to select the best matches between the unknown and the library (Aldrich Library, etc). If, however, the investigator does not have access to a reference spectrum of the compound under investigation, it can often be identified by functional group analysis together with a few easily determined physical and chemical properties such as melting point, index of refraction, and chemical analysis. A great advantage of infrared spectroscopy is that the interpretation of the infrared spectrum of a compound is based directly on the nature of the chemical bonds in the molecule.
Fourier Transform Infrared Spectrometer
OVERVIEW
Interferometry for chemical applications was first applied to the far infrared region. The main factors that influenced this were the relatively low energies emitted by the IR sources, relative simple optical requirements, and simplified mathematical requirements due to the fact that relatively few data points were required to perform the Fourier transformation. The development of a fast computational method (Cooley-Tookey algorithm) and microelectronics expanded the use of interferometers to the NIR and fundamental Mid IR regions. The purpose of this section is to highlight the principles behind the functioning of Fourier Transform Infrared (FT-IR) spectrometers and therefore facilitate your use of the instrument in the laboratory.
OBJECTIVES
After finishing this session and completing the individual write-up, you should be able to:
- •Explain in your own words the theory behind interferometry.
- •Summarize the operation of the FT-IR Spectrometer.
- •Set the main parameters to collect the infrared spectrum of a given sample.
INTERFEROMETRY
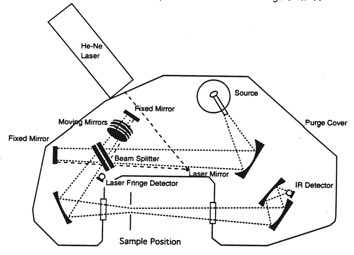
Most Fourier Transform Infrared (FT-IR) commercial spectrometers are based on the Michelson interferometer. Michelson designed this device and together with Morley used it to disprove the existence of the ether, the hypothetical medium through which light waves were thought to propagate.
The Michelson interferometer is essentially an optical assembly composed of a beamsplitter, a moving mirror, and a stationary or fixed mirror. The interferometer is used to split a beam of radiation into two beams and then recombining them after a path difference is introduced. The division of the beam is achieved with the beamsplitter, which transmits about 50% and reflects about 50% of the radiation.
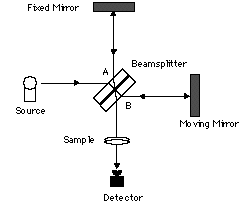
Figure 3. Michelson Interferometer
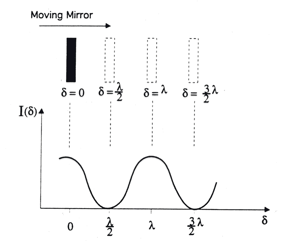
If radiation from an infinitely narrow line source hits the beamsplitter (Figure 3), one part of the beam (A), goes to the fixed mirror and the other beam (B), to the moving mirror. When the beams are recombined, an interference pattern is obtained as the Optical Path Difference (OPD) or the retardation δ is varied (OPD = 2 x mirror displacement). If the position of the moving mirror is such that beam (B) travels exactly the same distance as beam (A) before reaching the detector then the two beams will be in phase and will reinforce each other. Constructive interference occurs every time the value of the retardation δ is an integer multiple of the wavelength or δ = nλ; therefore, the energy arriving at the detector as a function of retardation I(δ) will be a maximum. On the other hand, if the position of the moving mirror is such that the optical pathlength of beam (B) is different from that of beam (A) by
 (where
  )
) then the two beams are 180° out of phase and will exactly cancel each other on destructive interference. In this case the energy that reaches the detector is a minimum. Thus, as the moving mirror travels a certain distance, an interferogram as in Figure 4 will result. The intensity of the radiation at the detector, I(δ), varies as a cosine function of the optical retardation δ.

Figure 4. Interferogram of a monochromatic, infinitely narrow line source
The resulting interferogram is described as an infinitely long cosine wave defined by the equation:

If the source emits more than one frequency (polychromatic radiation) every frequency is treated as if it resulted in a separate train of cosine waves. The resultant interferogram is obtained after adding the cosine waves geometrically, as in Figure 5. Mathematically this can be expressed as:

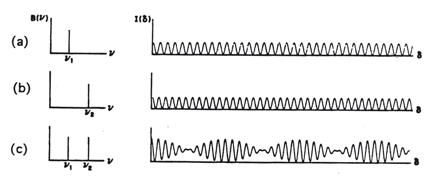
Figure 5. The interferogram of a single frequency source is a cosine function with a periodicity that varies with the frequency of the emitting source (a and b). The interferogram of a two-frequency source may be calculated by geometrically adding the cosine functions corresponding to each of the individual lines in the source (c).
As the moving mirror changes positions, it causes the waves that compose the infrared radiation undergo constructive and destructive interference when they recombine at the beamsplitter, producing an interferogram plot of the detector response, intensity in volts vs. the position of the moving mirror or retardation in cm (Figure 6).

Figure 6. Interferogram generation from a polychromatic IR source
For an IR source such as a nichrome wire electrically heated, the interferogram can be interpreted as a sum of cosine waves from each contributing frequency. For a continuous infrared source, the sum (2) goes over to an integral (3):

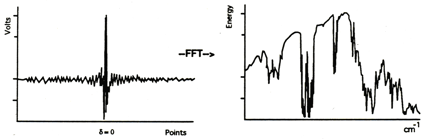
Resulting the interferogram shown in figure 7, the primary data obtained with a FT-IR spectrometer:
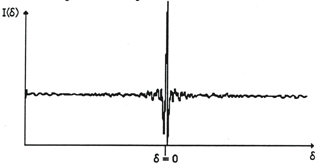
Figure 7. Interferogram of a typical infrared source
Note that at zero retardation, δ = 0, all the waves are in phase, this maximum is called the centerburst or the Zero Path Difference (ZPD) of the interferogram. Moving away from the ZPD in either direction, causes the intensity of the interferogram, I(δ), to die off as contributions from the various frequencies go in and out of phase with each other. The "spectrally meaningful" information is extracted from the wings of the interferogram as an infrared spectrum (plot of absorbance or %transmittance vs. reciprocal cm) by an operational amplifier that performs the mathematical operation called Fast Fourier Transform (FFT, conversion of the interferogram into a sum of sine and cosine functions).
The interferogram is measured by recording the detector signal as a function of the optical path difference between the two beams. The signal has to be sampled at precise intervals corresponding to equal steps in path difference. For signal averaging, successive interferograms have to be measured at exactly the same points. This is achieved by using a helium-neon laser as a reference. Radiation at exactly 632.8 nm traverses the same optical path as the IR beam. A separate detector measures the interferogram produced, giving a sinusoidal signal with maxima separated by the laser frequency at 15,803 cm-1. This signal is used to trigger the sampling of the IR signal very reproducibly.
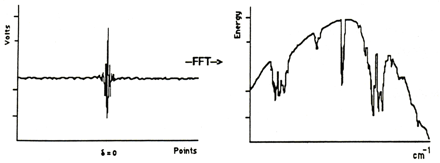
An interferogram contains all of the IR absorption information albeit in a form not useful to a chemical spectroscopist. The Fourier transform of this interferogram gives the conventional spectrum. The relationship between the interferogram and the spectrum is given by equation (5). This equation is the Fourier Transform pair of equation (3) given above.

The Fourier Transform operation changes the domain of the original data into its reciprocal; in this way the space domain data (interferogram) is turned into a reciprocal space domain data (the spectrum) as shown below. Notice that he slope of the single beam spectra obtained accurately resembles the intensity distribution of a black body radiator with the absorptions due to sample and air respectively embedded in the distribution.
Generation of a FT-IR spectrum
The FT-IR spectrometer generates the infrared spectrum of a given sample by calculating the ratio of the signal obtained by scanning air (empty beam) to the signal obtained by scanning the sample. The process is schematically illustrated in the figures below (Figs 8-9): first an interferogram of the source (background) is scanned, transformed into a single beam spectrum, and stored in computer memory:
The sample, in this case a polystyrene film, is then placed in the sample holder and the process is repeated:
The ratio between the two single-beam spectra, in computer memory, is calculated and the "double beam" presentation with a flattened baseline is produced. The features present in the background spectrum correspond to the emission profile of the source, the optical efficiency, or detectivity of the detector, the absorption of the film optical coatings, atmospheric water, and gaseous CO2. The ratio process compensates for these bands and they don't appear in the spectrum of the sample as shown below.
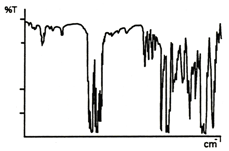
Figure 10. IR spectrum of polystyrene.
(a) Source
The most frequently used sources in the Mid IR region are Nernst Glowers, cylinders composed of a mixture of zirconium, yttrium and thorium, Globars which are silicon carbide rods, and incandescent wires of nichrome, or rhodium sealed in a ceramic cylinder. All of these sources exhibit the energy distribution of a theoretical black body radiator. However, the thermal sources are inefficient in the far infrared region, and the mercury arc, a quartz jacketed tube filled with Hg vapor has to be used.
(b) Beamsplitter
For the Mid–IR range 4,400 to 450 cm-1, the beamsplitter consists of a thin film of Germanium entirely deposited on a potassium bromide plate, except on its center for transmission purposes, this plate is covered by a clear potassium bromide plate. Plates of CsI covered in the same way with Silicon are also used. A film of iron (III) oxide deposited on CaCl2 plates is used for Near IR, and for Far IR applications a thin film of Mylar sandwiched between two plates of a low refractive index solid is used.
A Mid IR spectrometer should never be turned off, which would cause water condensation over the hygroscopic alkali beamsplitter, which will obscure the center of the plate impeding the transmission of light. If the instrument needs to be moved, it has to be packed with a dehydrating agent such as calcium sulfate to avoid damage to the beamsplitter and alkali windows.
(c) Detector
FT-IR spectrometers use either pyroelectric or photoconductive detectors. Pyroelectric detectors are a special kind of thermal detector consisting of single, thin, pyroelectric crystals such as deuterated triglycine sulfate (DTGS) or LITA (lithium tantalate). When a pyroelectric material is polarized by an electric field, it remains polarized after the field is removed due to an effect called residual electric polarization. This residual polarization is sensitive to changes in temperature.
Photoconductive detectors show an increase in electrical conductivity when illuminated with IR radiation. They have a rapid response and high sensitivity. The most commonly used photoconductive detector is the MCT (Mercury Cadmium Telluride), which must be cooled to liquid nitrogen temperatures for proper operation.
FT-IR Scanning parameters
- •Scanning Time: One scan taken with an FT-IR spectrometer is equivalent to a complete displacement of the moving mirror from the initial position to the final one. This change of position is referred to as the Optical Path Difference (OPD) or retardation because it sets the difference between the paths of the beams of light that come from the fixed mirror and from the moving mirror and recombine at the beamsplitter as explained above. The largest the distance traveled by the moving mirror, corresponds to the highest resolution that can be achieved. For this reason, the scanning time increases with resolution.
- •Signal to Noise Ratio (SNR): Indicates the quality of the baseline of the sample’s infrared spectrum; mathematically, the SNR is a comparison of the size of the noise to the size of the signal. The SNR improves with the number of scans acquired because of the averaging nature of the data acquisition: after averaging each scan the signal increases in size while the noise diminishes. The dominant noise in FT-IR is the detector-limited noise, which varies as the square root of the number of scans (
 for N scans). Hence, combining these two factors, the SNR varies with the number of scans N as
  . Acquiring a larger number of scans will improve the SNR or a cleaner baseline spectrum. For transmission experiments of condensed phase samples, 4 scans will suffice to obtain a good SNR, because of the high energy involved in the measurement. For gases, at least 16 scans must be acquired to assure good SNR. When reflectance accessories such as Diffuse, Specular, or Total reflectance are used, a minimum of 64 scans must be collected due to the limitation on the energy that reaches the detector or optical throughput.
 - •Resolution (spectral resolution): Indicates the ability of the spectrometer to distinguish two closely spaced vibrational or rotational modes. The resolution of the interferometer increases with δ and therefore with mirror travel. To a good approximation, the best resolution is given by

Where: ∆ = δmax is the maximum mirror travel distance. Since this mirror displacement cannot be infinite in an actual spectrometer, the resolution is somewhat less, as discussed below. For condensed samples acquired in transmission mode, a resolution of 8 cm-1 will resolve most vibrational modes, which full width at half height (FWHH) is about 10 cm-1. This resolution also allows the acquisition of a large number of scans at a relatively short time improving the SNR. If the rotational fine structure is required for the calculation of molecular parameters for gas samples, the best resolution of the spectrometer must be utilized together with the acquisition of a large number of scans for good SNR. Apodization functions limit spectral resolution, as it will be explained below, so for gas samples a simple truncation function called boxcar must be used.
- •Apodization: The mathematical form of the Fourier pair, equations (3) and (5), sets the integration limits to retardation values from -∞ to +∞. However, integration is physically impossible because the moving mirror travels a finite distance from -∆ cm to +∆ cm, which is determined by the design of the mirror drive. Setting these limits is equivalent to truncating the interferogram, or setting it equal to zero for all values greater than ∆ and less than -∆. This is known in mathematics as convoluting the complete interferogram (-∞< δ < +∞) with a function that has the value 1.0 for (-∆<δ < +∆) and zero for values of δ outside these limits (Figure 11). Because of its rectangular shape, this function is called boxcar and the process is called boxcar truncation.
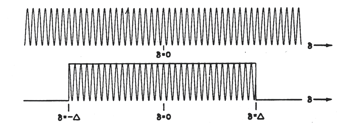
Figure 11. Boxcar Truncation on a monochromatic infinitely narrow line.
When the Fourier transform with boxcar truncation is performed, an infinitely narrow monochromatic line takes on width and acquires positive and negative side lobes, known as ringing (Figure 12). Mathematically this function is of the form sinx/x, which is known as sincx function. The full width at half height (FWHH) of the obtained function is 0.6/∆.
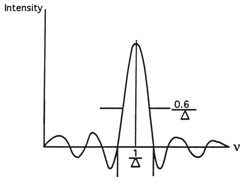
Figure 12. Effect of boxcar truncation on an infinitely narrow line.
The first minimum has a negative value, which is about 22% of the amplitude of the central positive frequency. If a weak line were present at the frequency value of this minimum, it could be lost from the computed spectrum. The elimination of the side lobes that result after truncating the interferogram with a boxcar function is known as apodization, and functions used for this purpose are called apodization functions. Triangular apodization is one of the simplest functions used. In Figure 13 boxcar truncation is contrasted to triangular apodization for the Fourier transformation of an infinitely narrow monochromatic line.
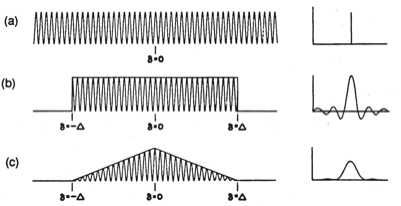
Figure 13. Comparison of triangular apodization and boxcar truncation.
The source is an infinitely narrow line. The interferogram (a) is an infinitely long cosine train, which transforms faithfully to return the infinitely narrow line. When boxcar truncation is used (b) the transformed line takes on width and exhibits positive and negative lobes. Triangular apodization (c) further increases line width but reduces the magnitude of the side lobes and makes them all positive. Note that although the triangular function decreased the side lobes, the resultant line width is considerably increased, affecting the resolution. There are several apodization functions, which employ a degree of non linearity or curvature in an effort to maintain resolution while reducing the ringing, these include Gaussian and Lorentzian functions, a raised cosine function (Hanning apodization), Happ-Genzel apodization and Norton-Beer functions.
When sampling liquids and solids in transmission mode, an apodization function of medium strength such as triangular that does not seriously affect resolution should be used. For gas sampling when rotational fine structure is required, no apodization function should be used. The boxcar truncation will maximize the resolution although the baseline will be affected. In this case a greater number of scans will ultimately favor the SNR of the spectrum.
ASSESSMENT
I. INTERFEROMETRY
- 1. Name and explain the functioning of the assembly shown and label the components.

- 2. In your own words, explain the following diagram. Use equations to illustrate your point.
- 3. Explain how the following graph was obtained. What does it represent?

II. Spectrometer Components and Functioning
- 4. What is a DTGS and how it works?
- 5. Is it a good practice to turn off a mid IR spectrometer? Explain.
- 6. Why is it necessary to collect a larger number of scans when using reflectance accessories than for transmission measurements?
- 7. Indicate the scanning conditions needed to resolve the fine rotational structure of the infrared spectrum of a sample of carbon monoxide with optimal SNR.
- 8. What effect will have on the appearance of the spectrum if the conditions used in the previous question were applied to a sample of liquid acetone? Explain answer using SNR, scanning time, and resolution?
EXPERIMENT
You will record an IR spectrum of hexane, hexanol, hexanoic acid, cyclohexanone, and benzoic acid. Research the structures of these compounds before coming to lab and identify the functional groups present in each.