EXPERIMENT 5
Visible Spectroscopy of Kool-Aid
BACKGROUND
This experiment will introduce you to spectroscopy. Spectroscopy is a field of study that deals with the interaction of matter and electromagnetic (EM) radiation. Matter can absorb, reflect or scatter EM radiation (although in most cases there is actually a combination of these interactions). Depending on the mode of interaction, we can distinguish between absorption spectroscopy, reflection spectroscopy and scattering spectroscopy. Different regions of the electromagnetic spectrum indicate different categories of spectroscopy such as visible (Vis), ultraviolet (UV), infrared (IR), and microwave.
Spectroscopy is used for the identification and quantitative measurement of organic and inorganic compounds in products such as foodstuffs, pharmaceuticals, paints, etc. The method is essential in both research and quality control in fields such as medicine and the life sciences.
Beer-Lambert's Law

Transmittance can be expressed as a percentage:

Often the same spectroscopic information that is reported as percent transmittance is more conveniently expressed as Absorbance (A); mathematically:

Beer-Lambert's Law is expressed as:

where:
ε is the extinction coefficient (M-1 cm-1).
ε is the extinction coefficient (M-1 cm-1).
c is the molar concentration of an absorbing substance (M or mol/L).
l is the path length through which the light travels (cm).
When most of the light striking a sample is absorbed, almost no light is transmitted; the medium is said to have a high absorbance and a low transmittance. The amount of light absorbed is directly proportional to the amount of sample present in the path of the light. This concept can be understood by examining the following diagram (figure 1):
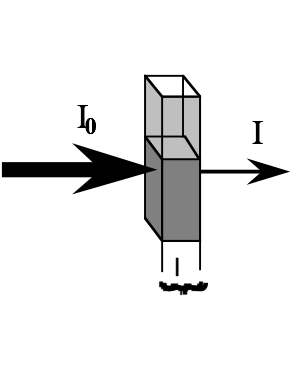
The intensity of the light beam diminishes as it travels through the absorbing medium. If the concentration (c) of the absorbing species is lowered (diluting the solution), then the absorbance decreases and the solution transmittance increases. The same effect is achieved if the pathlength (l) is decreased by using narrower cuvettes.
The extinction coefficient, ε, is a proportionality constant which depends on the nature of the solute and solvent, and on the wavelength of the light passing through it.
Beer-Lambert's law is a limiting law: it holds true only for dilute solutions whose concentrations are less than 0.01 M for organic compounds. At higher concentrations, the average distance between the molecules of the absorbing species decreases such that each molecule affects the charge distribution of its neighbors or form aggregates, thereby causing deviations from the linear relationship between absorbance (A) and concentration (c). Some organic molecules, like methylene blue, dimerize in solution even at concentrations below 10-6M. In these cases the linear dependence of A vs. c is not observed. Finally, deviations from linearity can arise simply because of instrumental error.
Spectrophotometric Analysis
Different types of radiant energy affect matter in different ways. Radio waves cause molecules to rotate. Infrared light causes molecules to rotate, bend, and stretch (rotational and vibrational transitions); visible and ultraviolet light cause electrons to jump from one orbital of lower energy to another of higher energy (electronic transitions). In each case, the energy absorbed is specific to the end event (i.e., it takes x amount of IR energy to cause a molecule to rotate, but y amount of energy to cause a molecule to bend).
Organic molecules containing double bonds are often photoreactive. The double bonds in these molecules are formed by π electrons. Whenever double bonds alternate with single bonds (i.e., the double bonds are conjugated), the probability that an electronic transition will occur in the visible region of the EM spectrum is increased. Organic molecules that contain a conjugated system of π electrons are called chromophores. Good examples of such molecules are dyes, which are chemicals used to color fabrics, plastics, etc. They contain multiple bonds like C=C, C=O, etc., which may be conjugated to other groups to form complex chromophores. A typical example of a chromophore is β-carotene, which is the orange color in carrots (Figure 2).

Figure 2: β-carotene, a chromophore
This molecule absorbs blue-green light (wavelength 460 nm), which is the complementary color of orange (620 nm).
In the case of transition metal salts and metallic complexes like copper sulfate pentahydrate (CuSO4•5H2O), potassium permanganate (KMnO4), iron (III) thiocyanate, ([Fe(SCN)]2+), etc., the color observed depends on the oxidation state of the metal and involves different types of electronic transitions.
Visible Spectrum

Colors that are complementary are found opposite each other on the color wheel. Complementary colors combine to form white light. If only one color is filtered out from white light, such as yellow for example, light of the complementary color results, violet in this particular case. In color technology (paper, textiles, paints, and coatings) colored pigments are combined. Combinations of complementary colored pigments will form black.
REFERENCES
Fine, L.W., Beall, H. and Stuehr, J. Chemistry for Scientists and Engineers (Preliminary paperback version of the new Second Edition). Philadelphia: Saunders College Publishing, 1999. Chapters 5 and 19.
Kotz, J.C. and Treichel, P. Jr. Chemistry & Chemical Reactivity (Fourth Edition). Fort Worth: Saunders College Publishing, 1999. Chapters 7 and 23.
Oxtoby, D.W., Freeman, W. and Block, T. Chemistry Science of Change (Third Edition). Philadelphia: Saunders College Publishing, 1998. 737-43, 648-51.
Skoog, D.A. and Leary, J.J. Principles of Instrumental Analysis (Fourth Edition). Fort Worth: Saunders College Publishing, 1992. Chapters 5, 6, 7 and 8.
PROCEDURE
PART 1. The Spectrum of Kool-Aid
You will be provided with a stock solution of purple Kool-Aid (7.2 g/100 mL), the concentration of which is similar to that of a drinkable glass.
Use an LKB spectrometer to obtain a visible spectrum (400-700 nm) of a 1:5 dilution of your stock solution. Set the spectrometer’s precision to “0-1A,” and fill a cuvette about two-thirds with distilled water. This is your blank. Fill another cuvette with the diluted Kool-Aid solution and record the absorbance of this solution at wavelengths between 400 and 700 nm. Begin using increments of 20 nm, but reduce them to 10, 5, and 2 nm as you near the peak absorbance in order to observe the shape of the peak accurately and pinpoint the maximum absorbance. Remember at each wavelength setting to first set the LKB to 0.000 Absorbance with the blank. Be careful to do this after you reach the desired wavelength, not before.
Plot the Spectrum
Plot the absorbance vs. wavelength for this solution and discuss your results.
PART 2. Identifying the Dyes in Kool-Aid
In this part of the experiment, you will separate the dyes in purple Kool-Aid using column chromatography and identify them based on their wavelengths of maximum absorption. We will defer a complete discussion of chromatography until a later experiment. For now, understand that chromatography simply makes use of different physical properties of compounds in a mixture such as polarity or boiling point to separate them. Here, we will pack a column with silica gel, an inorganic compound that is much more polar than the organic compounds one is typically interested in separating (such as food dyes). As more polar components of a mixture have a greater affinity for silica than less polar ones, they take a longer time to pass through a column. With a column that is sufficiently long, it is possible to completely (or almost completely) isolate the different components of a mixture.
Chromatographic Separation of Kool-Aid Dyes
You will prepare 2 miniature chromatography columns from Pasteur pipettes.
You will prepare 2 miniature chromatography columns from Pasteur pipettes.
- 1. Carefully push a small piece of cotton down to the narrow part of the pipette. Clamp the pipette with a thermometer clamp and add about 0.5 cm of sand (use a second pipette as a funnel).
- 2. In a small beaker, dissolve enough silica gel in 10 mL distilled water to make a thick slurry. Make sure the slurry is well-stirred and pipette about 5 cm into your column. Handle the silica gel in the hood as it is a carcinogen when inhaled.
- 3. To pack the column and rinse excess silica gel off the sides of the column, force water through the column using a small pipette bulb until the top of the silica is level.
- 4. Add another 0.5 cm sand to the top of the column. Load the column by pipetting about 0.5 mL of your concentrated Kool-Aid solution to the top of the column. The Kool-Aid will separate into fractions as it progresses through the column. Elute them with distilled water and collect in separate test tubes. Make sure your column never runs dry by adding distilled water as necessary. To speed the process you may push the solvent through with a pipette bulb. Make certain that your mentor demonstrates this technique before attempting it!
Determining the Purity of your Fractions by TLC
- 1. With a pencil, lightly mark a baseline on a TLC plate, usually about 1 cm from the bottom. Do not touch the silica face of the TLC plate with your fingers, as the oils on your skin will contaminate the plate. On the very top of the TLC plate, label the spots in pencil according to what is being spotted. Spot the plate by dipping the micropipette into the solution and touching it lightly to the TLC plate. Spot each of the fractions as well as the original solution. Be sure to use the matte (coated) side and not the plastic side.
- 3. Calculate the Rf (distance traveled by the spot divided by distance traveled by the solvent) for your fractions.
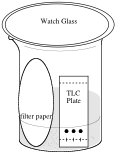
2. In a beaker, add a small amount of water and a piece of filter paper as in the diagram below. The level of the solvent in the jar must be below the level of the spots, and the atmosphere in the jar should be saturated with solvent vapors. This is the purpose of the filter paper. If the jar is not saturated with solvent vapors, the solvent will not run all the way up the plate. Gently place your plate in the chamber. When the solvent front is near the top of the plate, immediately remove the plate from the beaker with forceps and mark the solvent front with a pencil before the solvent evaporates.
Identifying the Dyes
- 1. You will be provided with stock solutions of two red dyes and two blue dyes. Using TLC, determine the Rf values of the dyes and make a hypothesis as to which of the dyes is contained in purple Kool-Aid.
- 2. Using an LKB spectrometer, determine the peak absorptions of the components you separated on your column. Based on their colors, choose an appropriate range of wavelengths to scan.
- 3. Prepare an approximately 1x10⁻⁵ M solutions of each dye and determine its peak absorption. Use your results to confirm your hypothesis of which dyes are contained in Kool-Aid.
RESULTS
Kool-Aid Spectrum
Tabulate the data you obtained for Kool-Aid as follows:
Wavelength (nm)
|
Absorbance
|
Wavelength (nm)
|
Absorbance
|
Wavelength (nm)
|
Absorbance
|
Maximum absorbance(s) of Kool-Aid peak(s):
Peak Absorbances and Rf Values of Dyes
Name of Dye
|
Max. Absorbance of Dye
|
Rf
|
|
1
|
|||
2
|
|||
3
|
|||
4
|
Dyes present in KoolAid: